Visualize Corporate Financial Data by Geographic Region
Utilizing connections between financial indicators and the companies they represent, it is possible to generate maps showing the aggregate market cap of various stocks, grouped by city or other geographic region.
Starting with companies on the S&P 500, you can retrieve symbols, market capitalization and the company entities associated with each stock.
Find the metropolitan area that each company's headquarters is located in and append those values to the original association.
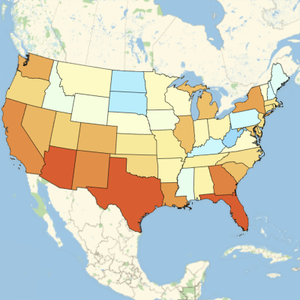
Group the data by metro area, and restrict to locations in the United States.
Find the total of all market cap values and the common names of all companies in each area.
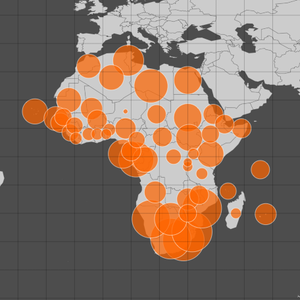
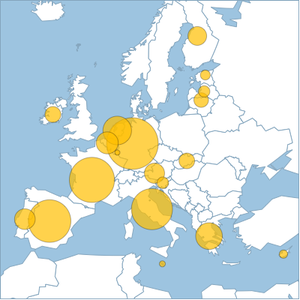
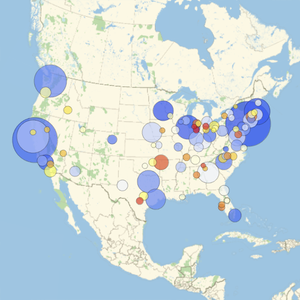
Create tooltips showing that data and generate a bubble chart.