
The Wolfram Solution forStatisticsPull in your data or ours, do standardized or custom analysis and visualization, then generate and deploy interactive reports—all in one system, with one integrated workflow. The Wolfram statistics solution includes powerful optimization and statistics functionality alongside unique capabilities like free-form linguistic input, instant interactivity, and the reliability of any-precision numerics and symbolic analysis. |
 |

Wolfram technologies include thousands of built-in functions and curated data on many topics that let you:
- Model and analyze system reliability, including the life expectancy of a component or the reliability of engineering materials, using built-in reliability analysis functionality
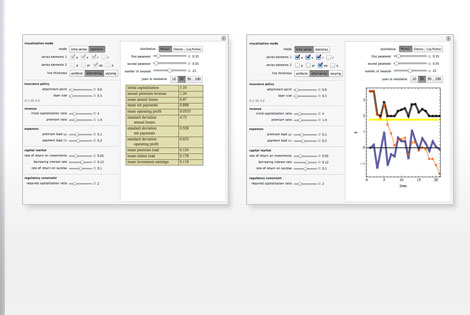
- Build and analyze statistical models for futures trading and other applications in finance
- Determine insights by analyzing current and historical built-in financial, socioeconomic, geographic, and demographic data
- Study public health statistics, voting patterns, consumer spending data, and more for predictive modeling
- Perform Monte Carlo simulations and bootstrap analyses, estimate probabilities, and more for pricing options and other finance applications
- Solve optimization problems in many diverse fields, such as production, supply-chain management, engineering design, finance, and more, using built-in or user-defined routines
- Generate user-defined or built-in 2D and 3D graphics for visualizing data
- Create interactive applications, reports, and presentations for instant deployment through the Wolfram CDF Player or webMathematica
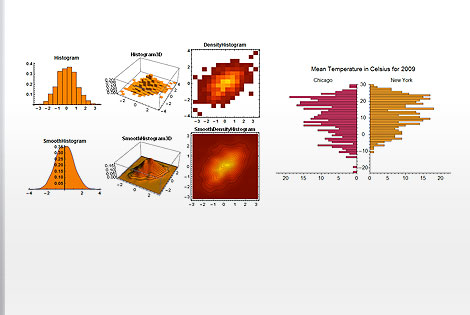
Fit, test, and describe properties of data
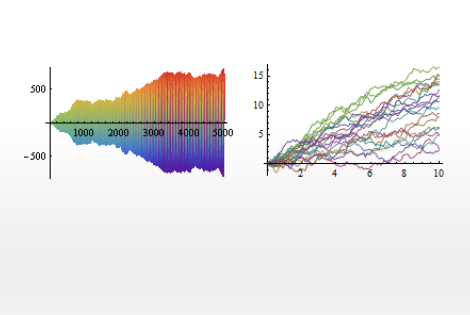
Simulate fractional price changes with a logistic distribution
Does your current tool set have these advantages?
- More statistical distributions than any other system, with specialized coverage for finance, medicine, engineering, and science
-
Instantly create dynamic interfaces that allow you to vary parameters and gain useful insights from datasets
Unique to Mathematica -
Automated precision control and arbitrary-precision numerics produce highly accurate results
Excel, MATLAB, and other systems that rely on finite-precision numerics can cause serious errors due to lack of precision -
Built-in functionality for statistical analysis and computation, curve fitting, image processing, and a range of other application areas
MATLAB requires the purchase of extra tool boxes -
Seamless integration of numerics, symbolics, interactive graphics, and all other computational aspects in one document
Unique to Mathematica -
Powerful symbolic statistical computation and built-in functions for all standard statistical distributions
MATLAB, R, STATA, and other numerical systems do not have integrated symbolic functionality -
Integrated access to financial, socioeconomic, geographic, scientific, and other data suitable for computation without preprocessing
Built-in curated data is not available in other software -
Complete statistical analysis workflow, from data import to analysis to typeset report or slide show, in a single document
R, SAS, S-PLUS, Minitab, and other software do not support a complete analysis workflow in a single document
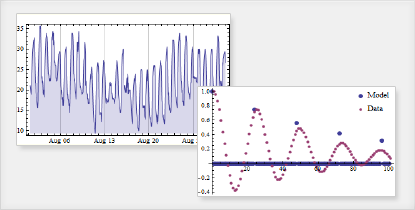
Modeling seasonal data with built-in SARMA process functionality
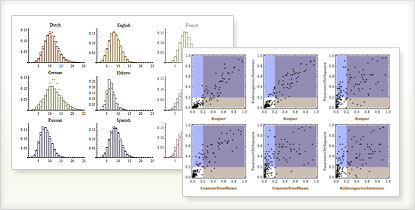
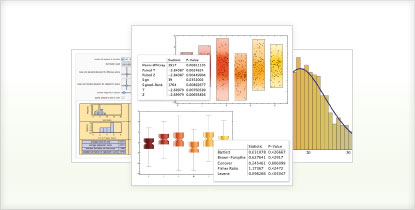
Compare empirical and fitted distributions or use Monte Carlo simulations for goodness of fit
Statistics specific capabilities:
- Built-in descriptive statistics functions for all standard statistical distributions and data »
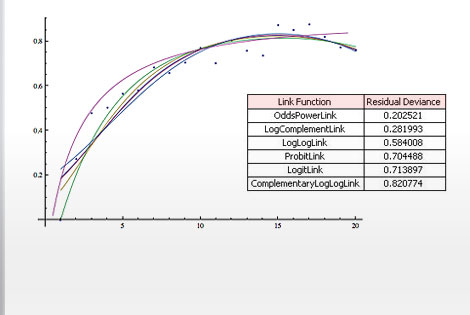
- Fit and analyze parametric models of data, including linear, nonlinear, logit, probit, and generalized linear models »
- Estimate distribution parameters from data using likelihood and moment-based methods
- Automatically compute the probability of any event and the expectation of any expression for univariate and multivariate distributions
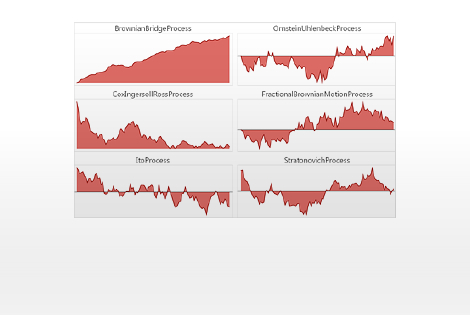
- Broad support for random processes, including parametric processes, finite Markov processes, queueing processes, time series, and stochastic differential equation processes »
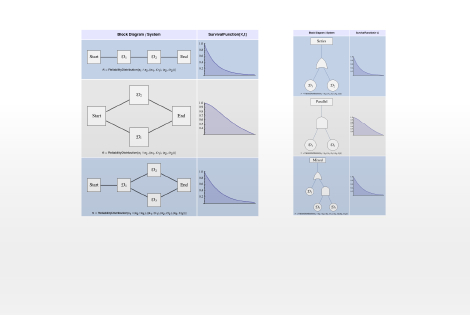
- Complete suite for reliability analysis, with functionality for reliability block diagrams, fault trees, standby models, and importance measures »
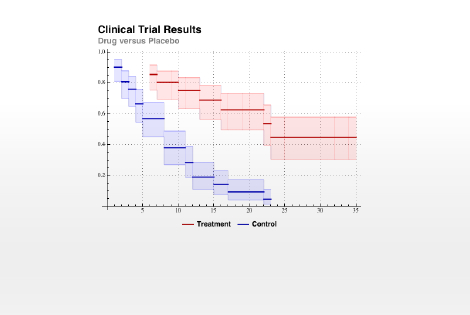
- Built-in survival analysis functionality includes support for censored data, optimized parametric and nonparametric survival modeling frameworks, and a range of generalized hypothesis-testing functions »
- Work with hundreds of statistical distributions and define new distributions from data, formulas, or other distributions, including copulas, mixtures, order statistics, censoring, truncation, transforms, and kernel density estimates »
- Test goodness of fit, location, and scale using automated test selection or by choosing specific parametric or nonparametric tests
- Efficient random number generation for simulating events, estimating probablities, numerically testing symbolic results, and more »
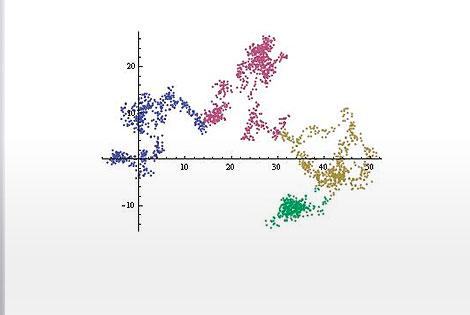
- State-of-the-art data classification algorithms for visualizing distributions, searching for nearest neighbors, and performing cluster analysis on large datasets »
- Wide variety of built-in standard charts and graphs, including pie and bar charts, paired histograms, box-and-whisker charts, radar plots, and quantile plots »
- Integrate R code into your Mathematica workflow, exchanging data between Mathematica and R and executing R code from within Mathematica.
- Built-in access to Wolfram|Alpha's continually updated computable data, such as financial data, weather data, and more »
- Immediate computation on streaming data from Bloomberg with Wolfram Finance Platform »
- Seamlessly import and export data in hundreds of formats »
- Create interactive content in the .cdf format and immediately deploy it to the free Wolfram CDF Player as slide shows, reports, books, applications, and web objects
- Complete statistical analysis workflow, from data import to analysis to visualization and deployment, in one system


Organizations Using Wolfram Technologies
 |
 |
 |
 |
Download a Free Trial of Mathematica
Get your free, fully functional, 15-day trial version of Mathematica via download.

|
