OpacityFunction and ColorFunction
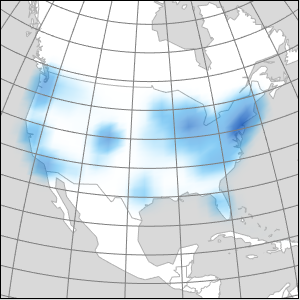
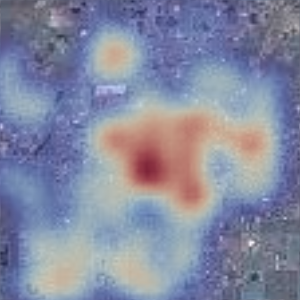
Plot the density of tree locations in Champaign, Illinois, using a named color function.
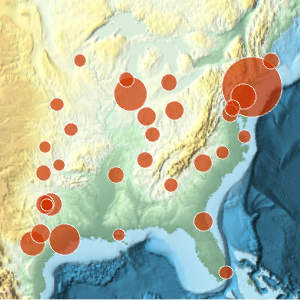
Use a custom color function that ranges from light green to dark green to shade the density of trees.
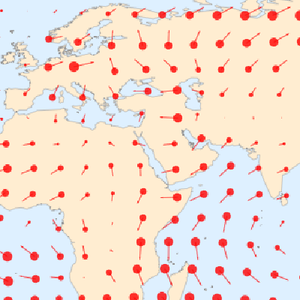
Decrease the opacity so that more of the background map is visible.