Visualization
Use any Wolfram Language visualization function on a databin:
| In[1]:= |

| Out[1]= |
|
| In[2]:= |
| Out[2]= |
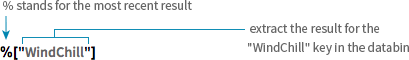
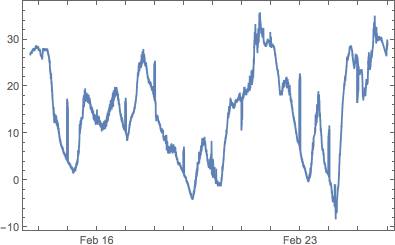
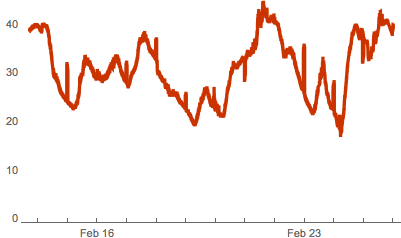
![{{%["WindChill"] gets the "WindChill" key of the most recent result, so this will return a plot of values of "WindChill"}}](images/O_2.png)
|
| In[3]:= |
| Out[3]= |
|
| In[4]:= |

| Out[4]= |
|
| In[5]:= |
| Out[5]= |
|
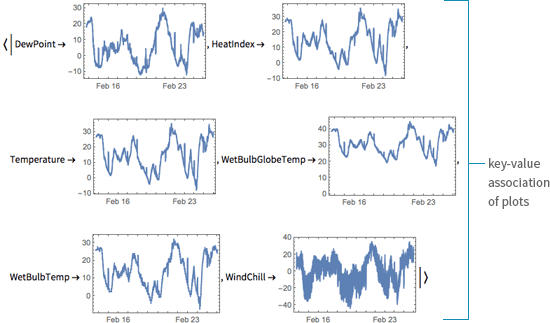
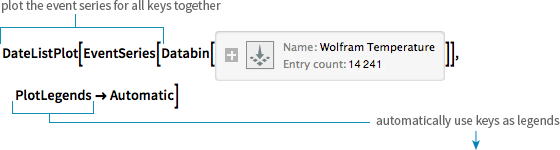
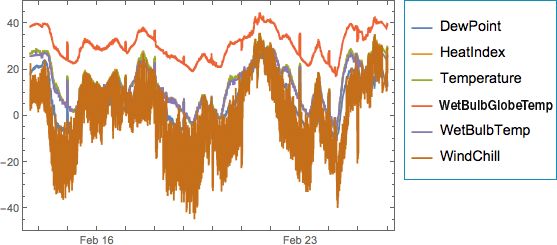
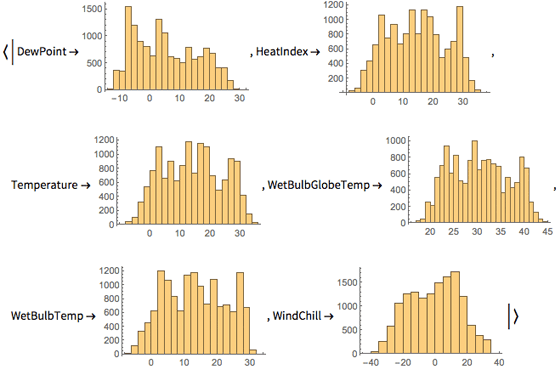
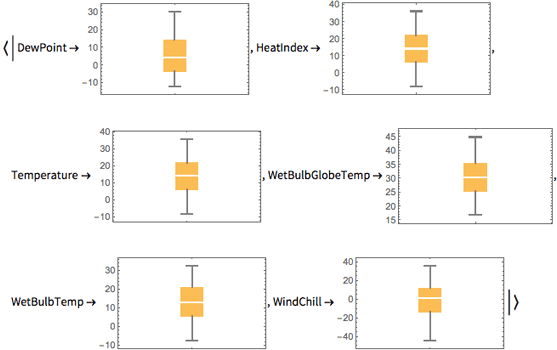
Use DateListPlot/@EventSeries[Databin["ID"]] to get separate plots for each key.
| In[6]:= |
| Out[6]= |
|
QUICK REFERENCE: Styling Options »
| In[7]:= |

| Out[7]= |
|
| In[8]:= |

| Out[8]= |
|
QUICK REFERENCE: Data Visualization Functions »


