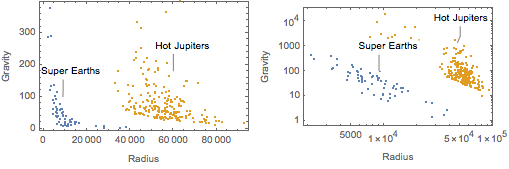
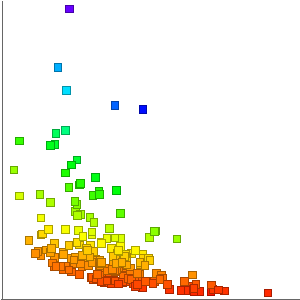
Exoplanetas
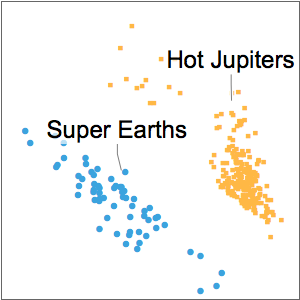
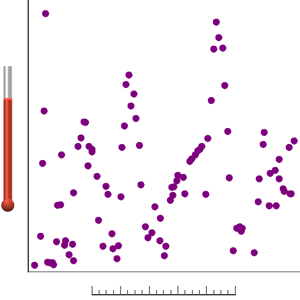
Use rótulos para identificar distintas clases de planetas en un gráfico.
In[1]:=
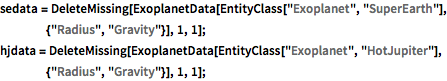
sedata = DeleteMissing[
   ExoplanetData[
    EntityClass["Exoplanet", "SuperEarth"], {"Radius", "Gravity"}], 1,
    1];
hjdata = DeleteMissing[
   ExoplanetData[
    EntityClass["Exoplanet", "HotJupiter"], {"Radius", "Gravity"}], 1,
    1];
In[2]:=
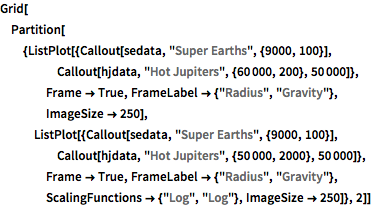
Grid[Partition[{ListPlot[{Callout[sedata,
      "Super Earths", {9000, 100}],
     Callout[hjdata, "Hot Jupiters", {60000, 200}, 50000]},
    Frame -> True, FrameLabel -> {"Radius", "Gravity"},
    ImageSize -> 250],
   ListPlot[{Callout[sedata, "Super Earths", {9000, 100}],
     Callout[hjdata, "Hot Jupiters", {50000, 2000}, 50000]},
    Frame -> True, FrameLabel -> {"Radius", "Gravity"},
    ScalingFunctions -> {"Log", "Log"}, ImageSize -> 250]}, 2]]
Out[2]=