RegionFunction
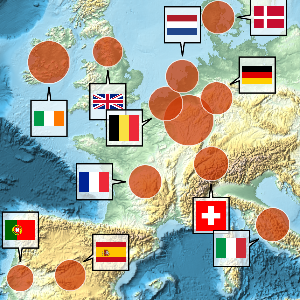
Geo visualization functions make it easy to restrict the plots to specific geo regions.
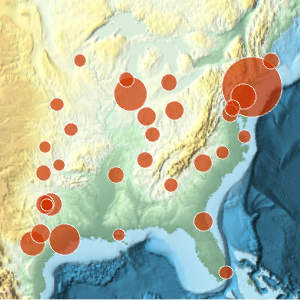
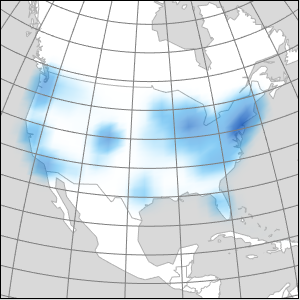
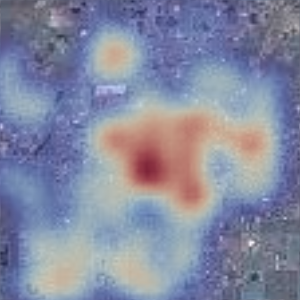
Generate a smooth histogram of the 500 largest cities in Italy and restrict the histogram to the country.
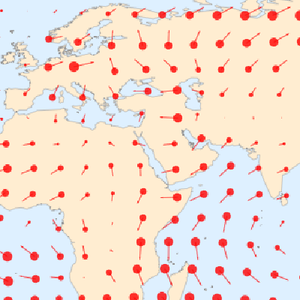
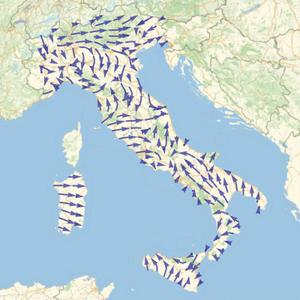
Get wind vector data for the cities.
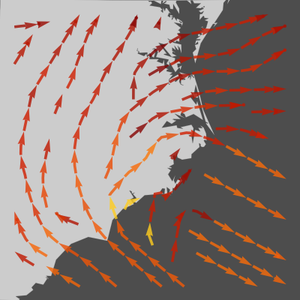
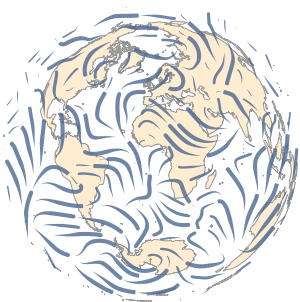
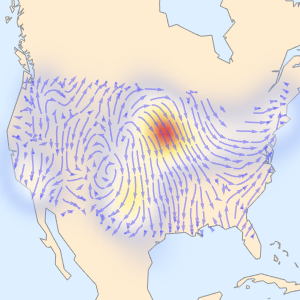
Plot streamlines based on the wind vector field and restrict the streamlines to the country.