Find Outliers in Numeric Data
Outliers (or anomalies) can be defined as data points that are much rarer than most other data points. This example uses a simple numeric dataset to show how to find anomalies, and to relate anomaly detection to the concept of "rarer probability".
Load Fisher's Irises dataset and select the "PetalLength" and "SepalWidth" attributes.
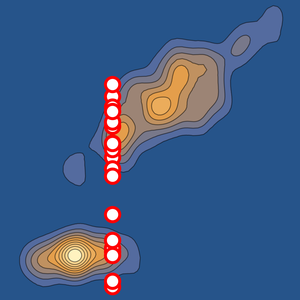
Find outliers in the dataset.
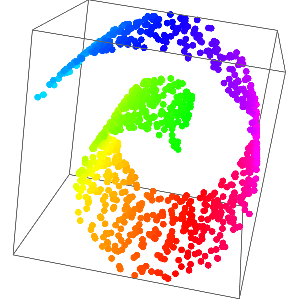
Visualize the position of the outliers compared to the rest of the data.
An anomaly detector function can also be obtained from the data.
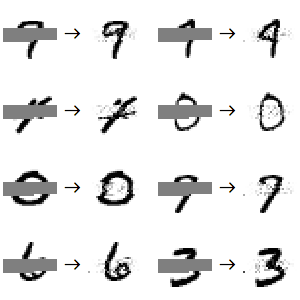
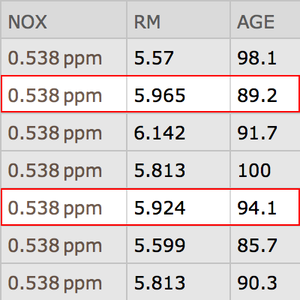
Use the detector function to find outliers.
Use the detector function on specific examples.
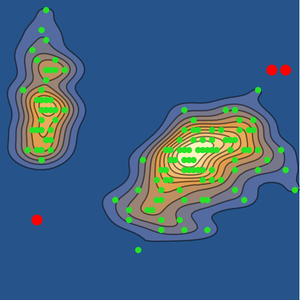
Each anomaly detector contains a LearnedDistribution trained on the data points that were considered non-anomalous. From this distribution, one can compute the RarerProbability of new examples.
The rarer probability is used to define which examples are outliers. By default, any example with a rarer probability smaller than 0.001 is considered an outlier. Visualize the rarer probability function, the outlier decision boundary and the data.