Wolfram Archive
Wolfram Programming Lab is a legacy product.
All the same functionality and features, including access to Programming Lab Explorations, are available with Wolfram|One.
Start programming now. »
Try it now »
(no sign-in required)
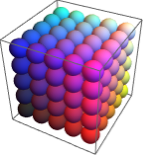
Color Cube

Visualize red-green-blue color space.

Run the code to make a swatch of color by specifying RGB components. Try other color components:

Note: use color component values between 0 and 1.

SHOW/HIDE DETAILS

Use RGBColor to specify a color from its red, green and blue components.

This gives pure red because the green and blue components are zero:

RGBColor[{1, 0, 0}]

Mixing red and green gives yellow:

RGBColor[{1, 1, 0}]

Color component values lie between 0 and 1.

When all of the color components are 0, you get black:

RGBColor[{0, 0, 0}]

When all of the color components are 1, you get white:

RGBColor[{1, 1, 1}]

Mixing different amounts of each component gives different colors:

RGBColor[{.9, .7, .5}]
RGBColor[{.5, .7, .9}]

HIDE DETAILS
RGBColor[{.9, .7, .5}]

Make a color sphere. Try other colors:

SHOW/HIDE DETAILS

This draws a sphere:

Graphics3D[Sphere[]]

This colors the sphere red:

Graphics3D[{RGBColor[{1, 0, 0}], Sphere[]}]

HIDE DETAILS
Graphics3D[{RGBColor[{1, 0, 0}], Sphere[]}]

Make a 5×5×5 array of spheres (each of radius 1/2). Try other sizes of arrays, and other radii:

SHOW/HIDE DETAILS

This draws a sphere at coordinate {1,1,1} with a radius of 1/2 (PlotRange specifies the extent of the drawing area; you can ignore it for now):

Graphics3D[ Sphere[{1, 1, 1}, 1/2], PlotRange -> {{0, 6}, {0, 6}, {0, 6}}]

Change the coordinate to draw the sphere somewhere else:

Graphics3D[ Sphere[{2, 4, 3}, 1/2], PlotRange -> {{0, 6}, {0, 6}, {0, 6}}]

Table makes arrays of things. Use Table to draw a whole array of spheres.

This makes an array of 3 numbers:

Table[10 i, {i, 3}]

With two indices, you get a two-dimensional array (an array of arrays):

Table[10 i +j, {i, 3}, {j, 3}]

This uses Table to make a one-dimensional array of spheres:

Graphics3D[ Table[Sphere[{i, 1, 1}, 1/2], {i, 5}], PlotRange -> {{0, 6}, {0, 6}, {0, 6}}]

Add an index to get a two-dimensional array of spheres:

Graphics3D[ Table[Sphere[{i, j, 1}, 1/2], {i, 5}, {j, 5}], PlotRange -> {{0, 6}, {0, 6}, {0, 6}}]

Add a third index to get a three-dimensional array of spheres:

Graphics3D[ Table[Sphere[{i, j, k}, 1/2], {i, 5}, {j, 5}, {k, 5}], PlotRange -> {{0, 6}, {0, 6}, {0, 6}}]

You can remove the PlotRange; without it, the drawing area is automatically made just large enough to contain the spheres:

Graphics3D[Table[Sphere[{i, j, k}, 1/2], {i, 5}, {j, 5}, {k, 5}]]

HIDE DETAILS
Graphics3D[Table[Sphere[{i, j, k}, 1/2], {i, 5}, {j, 5}, {k, 5}]]

Make the spheres different colors. Try reordering the color componentsfor example, {j,i,k}:

Note: rotate the cube to see other orientations.

SHOW/HIDE DETAILS

This gives a one-dimensional array of colors that vary from almost black to red (dividing by 5 keeps the color components between 0 and 1):

Table[RGBColor[{i, 0, 0}/5], {i, 5}]

This gives a two-dimensional array of colors:

Table[RGBColor[{i, j, 0}/5], {i, 5}, {j, 5}]

Use the same strategy to color the spheres in an array:

Graphics3D[ Table[{RGBColor[{i, j, k}/5], Sphere[{i, j, k}, 1/2]}, {i, 5}, {j, 5}, {k, 5}]]

HIDE DETAILS
Graphics3D[ Table[{RGBColor[{i, j, k}/5], Sphere[{i, j, k}, 1/2]}, {i, 5}, {j, 5}, {k, 5}]]

Manipulate the radius of each sphere. Drag the slider to change the sizes of the spheres:

Note: rotate the color cube to see it from a different angle.

SHOW/HIDE DETAILS

Manipulate puts an interactive interface onto a piece of code.

This draws a sphere with radius 1/2:

Graphics3D[Sphere[{0, 0, 0}, 1/2], PlotRange -> 1]

Make the radius interactive by wrapping the code with Manipulate, replacing 1/2 with the variable r and specifying that r goes from 0 to 1. Drag the slider to change the radius of the sphere:

Manipulate[ Graphics3D[Sphere[{0, 0, 0}, r], PlotRange -> 1], {r, 0, 1} ]

Do the same thing with the array of spheres:

Manipulate[ Graphics3D[ Table[{RGBColor[{i, j, k}/5], Sphere[{i, j, k}, r]}, {i, 5}, {j, 5}, {k, 5}]], {r, .1, .5}]

HIDE DETAILS
Manipulate[ Graphics3D[ Table[{RGBColor[{i, j, k}/5], Sphere[{i, j, k}, r]}, {i, 5}, {j, 5}, {k, 5}]], {r, .1, .5}]

Share Itmake an interactive color cube website:

SHOW/HIDE DETAILS

Deploy the Manipulate to the Wolfram Cloud, where anyone with a browser can use it:

CloudDeploy[ Manipulate[ Graphics3D[ Table[{RGBColor[{i, j, k}/5], Sphere[{i, j, k}, r]}, {i, 5}, {j, 5}, {k, 5}]], {r, .1, .5}], Permissions -> "Public" ]

Click the link in the output to visit the site.

Tell the world about your creation by sharing the link via email, tweet or other message.

HIDE DETAILS
CloudDeploy[ Manipulate[ Graphics3D[ Table[{RGBColor[{i, j, k}/5], Sphere[{i, j, k}, r]}, {i, 5}, {j, 5}, {k, 5}]], {r, .1, .5}], Permissions -> "Public" ]