Wolfram Archive
Wolfram Programming Lab is a legacy product.
All the same functionality and features, including access to Programming Lab Explorations, are available with Wolfram|One.
Start programming now. »
Try it now »
(no sign-in required)
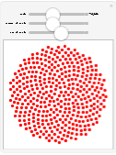
Phyllotaxis Spirals

Explore the spiral structures of daisies and sunflowers.

Run the code to draw a spiral. Try angles other than 5 degrees:

Note: to try other angles, change both occurrences of the angle.

SHOW/HIDE DETAILS

This gives the coordinates of eight points with 45° spacing around a circle (type deg to get the degree symbol (°)):

Table[{Sin[t 45 \[Degree]], Cos[t 45 \[Degree]]}, {t, 8}]

This draws the points:

Graphics[Point[ Table[{Sin[t 45 \[Degree]], Cos[t 45 \[Degree]]}, {t, 8}]], Axes -> True]

Make the angle smaller and the number of points larger to get a tighter circle of points (a lot of the points overlap):

Graphics[Point[ Table[{Sin[t 5 \[Degree]], Cos[t 5 \[Degree]]}, {t, 400}]], Axes -> True]

Multiply by the square root of t to make the points spiral out from the center:

Graphics[Point[ Table[Sqrt[t] {Sin[t 5 \[Degree]], Cos[t 5 \[Degree]]}, {t, 400}]], Axes -> True]

HIDE DETAILS
Graphics[Point[ Table[Sqrt[t] {Sin[t 5 \[Degree]], Cos[t 5 \[Degree]]}, {t, 400}]]]

Make a spiral with the golden angle. Try numbers of points other than 400:

SHOW/HIDE DETAILS

Plant structures like the daisy flower above are often arranged in spirals whose angle is the golden angle:

ga = 360./GoldenRatio^2

When you draw spirals with the golden angle, the points pack together evenly throughout:

Graphics[Point[ Table[Sqrt[t] {Sin[t ga \[Degree]], Cos[t ga \[Degree]]}, {t, 400}]]]

HIDE DETAILS
ga = 360./GoldenRatio^2; Graphics[Point[ Table[Sqrt[t] {Sin[t ga \[Degree]], Cos[t ga \[Degree]]}, {t, 400}]]]

Make the points larger and red. Try other sizes and colors (like Blue or Orange):

SHOW/HIDE DETAILS

Make the points larger with PointSize (put multiple graphics elements in a list, indicated by curly braces):

ga = 360./GoldenRatio^2; Graphics[{PointSize[.03], Point[Table[ Sqrt[t] {Sin[t ga \[Degree]], Cos[t ga \[Degree]]}, {t, 400}]]}]

Make the points red:

ga = 360./GoldenRatio^2; Graphics[{PointSize[.03], Red, Point[Table[ Sqrt[t] {Sin[t ga \[Degree]], Cos[t ga \[Degree]]}, {t, 400}]]}]

HIDE DETAILS
ga = 360./GoldenRatio^2; Graphics[{PointSize[.03], Red, Point[Table[ Sqrt[t] {Sin[t ga \[Degree]], Cos[t ga \[Degree]]}, {t, 400}]]}]

Explore different angles. Drag the slider to change the angle:

Hint: press (or ) for fine control while dragging the slider; press + (or +) for even finer control.

SHOW/HIDE DETAILS

The arrangement you get with the golden angle is very sensitive to changes in the angle. Changing the angle by a tiny amount from the golden anglejust one tenth of a degree heredestroys the nice packing:

ga = 360./GoldenRatio^2; Graphics[{PointSize[.03], Red, Point[Table[ Sqrt[t] {Sin[t (ga + 0.1) \[Degree]], Cos[t (ga + 0.1) \[Degree]]}, {t, 400}]]}]

Make an interactive interface to explore angles using Manipulate.

Wrap the Graphics expression with Manipulate, replace the fixed angle ga with the variable a, and specify that a ranges from 0 to 360, with an initial value of ga. The option AppearanceLabeled puts the angle value next to the slider, so you can see how it changes as you drag the slider:

ga = 360./GoldenRatio^2; Manipulate[ Graphics[{Red, PointSize[.03], Point[Table[ Sqrt[t] {Sin[t a \[Degree]], Cos[t a \[Degree]]}, {t, 400}]]}], {{a, ga, "angle"}, 0, 360, Appearance -> "Labeled"} ]

HIDE DETAILS
ga = 360./GoldenRatio^2; Manipulate[ Graphics[{Red, PointSize[.03], Point[Table[ Sqrt[t] {Sin[t a \[Degree]], Cos[t a \[Degree]]}, {t, 400}]]}], {{a, ga, "angle"}, 0, 360, Appearance -> "Labeled"} ]

Add controls for the size and number of points:

SHOW/HIDE DETAILS

Replace the fixed point size .03 with the variable s and the fixed number of points 400 with n:

ga = 360./GoldenRatio^2; Manipulate[ Graphics[{Red, PointSize[s], Point[Table[ Sqrt[t] {Sin[t a \[Degree]], Cos[t a \[Degree]]}, {t, n}]]}], {{a, ga, "angle"}, 0, 360, Appearance -> "Labeled"}, {{n, 400, "number of points"}, 1, 1000}, {{s, .03, "size of points"}, 0, .05} ]

HIDE DETAILS
ga = 360./GoldenRatio^2; Manipulate[ Graphics[{Red, PointSize[s], Point[Table[ Sqrt[t] {Sin[t a \[Degree]], Cos[t a \[Degree]]}, {t, n}]]}], {{a, ga, "angle"}, 0, 360, Appearance -> "Labeled"}, {{n, 400, "number of points"}, 1, 1000}, {{s, .03, "size of points"}, 0, .05} ]