Wolfram Programming Lab is a legacy product.
All the same functionality and features, including access to Programming Lab Explorations, are available with Wolfram|One.
Start programming now. »
All the same functionality and features, including access to Programming Lab Explorations, are available with Wolfram|One.
Start programming now. »
About the Wolfram Language »
Wolfram Programming Lab
Sign in to try »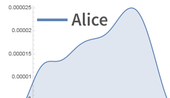
Story Flow in Alice
Get a sense of the flow of Alice in Wonderland by plotting where “Alice” and “Queen” occur in the story.
Run the code to get the text of Alice in Wonderland. Try other texts, like “TheRaven” or “Hamlet”:
text = ExampleData[{"Text", "AliceInWonderland"}];
Find the positions of “Alice” in the text. Find the positions of other words:
First /@ StringPosition[text, "Alice"]
Plot where “Alice” occurs in the story. Make plots for other words:
SmoothHistogram[First /@ StringPosition[text, "Alice"],
Filling -> Axis]
Add a legend:
SmoothHistogram[
Legended[First /@
StringPosition[ExampleData[{"Text", "AliceInWonderland"}],
"Alice"], "Alice"], Filling -> Axis]
Show “Alice” and the “Queen” at the same time:
SmoothHistogram[{Legended[
First /@
StringPosition[ExampleData[{"Text", "AliceInWonderland"}],
"Alice"], "Alice"],
Legended[
First /@
StringPosition[ExampleData[{"Text", "AliceInWonderland"}],
"Queen"], "Queen"]}, Filling -> Axis]
Make it a function. Try other character names:
Run this first to define the function:
storyflowinalice[names_] :=
SmoothHistogram[
Legended[First /@
StringPosition[
ExampleData[{"Text", "AliceInWonderland"}], #], #] & /@ names,
Filling -> Axis]
Plot the story flow using the function:
storyflowinalice[{"Alice", "Queen", "Hatter"}]
Start programming now (no sign-in required)
Already have a plan? Sign in »