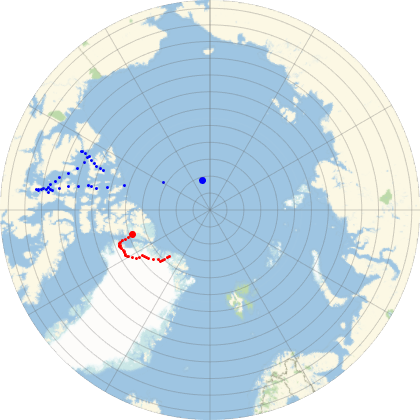
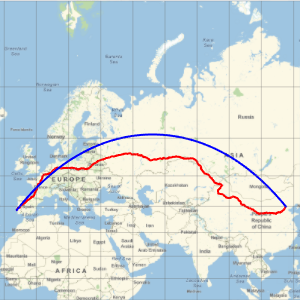
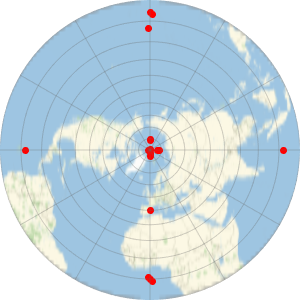
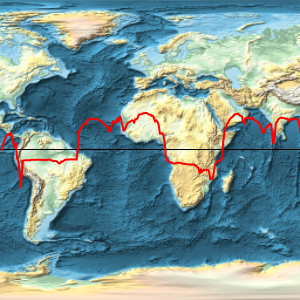
North Magnetic Poles
The Earth's magnetic field changes in time, due to the movement of the Earth's core. This example shows the displacement of the magnetic poles since 1656.
Construct a range of dates with steps of 10 years.
In[1]:=
dates = DateRange[DateObject[{1656}], DateObject[{2016}],
   Quantity[10, "Years"]];
GeomagneticModelData can compute the orientation of the best dipolar fit to the magnetic field. That determines the so-called geomagnetic North and South poles, which are antipodal by construction.
In[2]:=
geomagneticNorth =
  GeomagneticModelData["NorthGeomagneticPole", dates];
GeomagneticModelData can also compute the positions of the magnetic North and South poles, which are the locations at which the magnetic lines are vertical. In general, they will not be antipodal points.
In[3]:=
dipNorth = GeomagneticModelData["NorthModelDipPole", dates];Represent the evolution in time of the North magnetic (blue) and geomagnetic (red) poles, with the current positions denoted with a bigger point.
In[4]:=
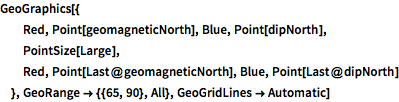
GeoGraphics[{
  Red, Point[geomagneticNorth], Blue, Point[dipNorth],
  PointSize[Large],
  Red, Point[Last@geomagneticNorth], Blue, Point[Last@dipNorth]
  }, GeoRange -> {{65, 90}, All}, GeoGridLines -> Automatic]
Out[4]=