Wolfram Language

Units & Dates

Visualize Geomagnetic Data

Use quantities and arrays of them anywhere in the visualization functionality.

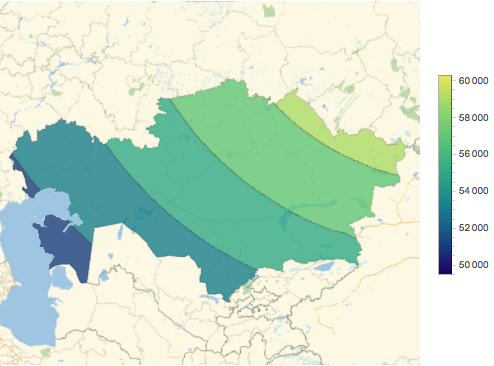
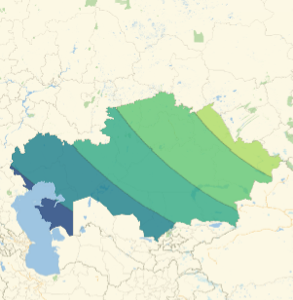
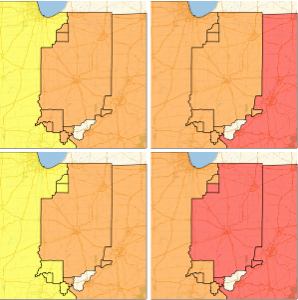
Get a quantity array of values for the magnitude of the Earth's magnetic field over Kazakhstan.

In[1]:=
Click for copyable input
data = GeomagneticModelData[Entity["Country", "Kazakhstan"], "Magnitude"]
Out[1]=

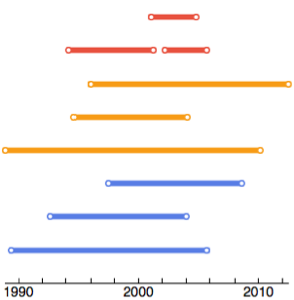
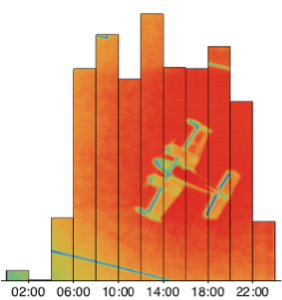
Examine the variation of the field over that region.

show complete Wolfram Language input
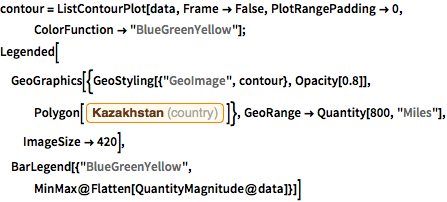
In[2]:=
Click for copyable input
contour = ListContourPlot[data, Frame -> False, PlotRangePadding -> 0, ColorFunction -> "BlueGreenYellow"]; Legended[GeoGraphics[{GeoStyling[{"GeoImage", contour}, Opacity[0.8]], Polygon[Entity["Country", "Kazakhstan"]]}, GeoRange -> Quantity[800, "Miles"], ImageSize -> 420], BarLegend[{"BlueGreenYellow", MinMax@Flatten[QuantityMagnitude@data]}]]
Out[2]=

Related Examples

de es fr ja ko pt-br ru zh