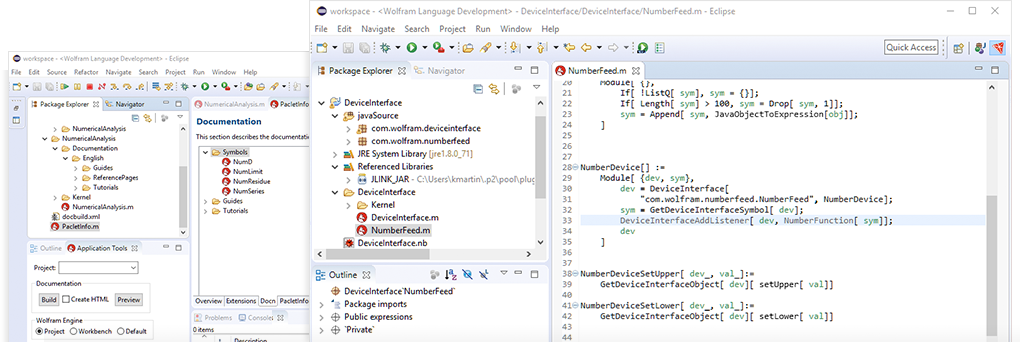
Wolfram Workbench
Eclipse-based IDE for Wolfram Language
Wolfram Workbench provides code editing, navigation and project management tools for enterprise-class development and deployment. A powerful Eclipse plugin, Workbench is specialized for Wolfram Language, Mathematica and other Wolfram products and technologies.
Integrate with Wolfram Technologies
Wolfram Language
Workbench allows you to dramatically improve your productivity when developing Wolfram Language code in Mathematica and other Wolfram products. It provides advanced tools for organizing resources, preventing mistakes and properly documenting your work. With Workbench you get all the features you would expect from an advanced IDE, such as:
- Working with code in a specialized editor
- Debugging programs at the source level
- Profiling the code's execution
- Developing and running tests
- Coding in an integrated workgroup environment
- Writing documentation for your application and more
webMathematica
Workbench provides tools for developing sites built with webMathematica. The full development cycle is supported with a dedicated editor, project types, server controls, debugging and real-time logging display. Integrating these tools into one application makes developing webMathematica-powered sites easier and faster than ever before.
gridMathematica
gridMathematica programs launched by Workbench create connections between all of the clusters' kernels and Workbench. This allows breakpoints and stack inspections to be made on any of the kernels in your gridMathematica cluster.
J/Link
Workbench provides a significant amount of support for developing J/Link applications, including:
- Wizards to create projects that mix Wolfram Language and Java using the J/Link toolkit
- Error markers in Wolfram Language when Java classes cannot be found
- Finding definitions from Wolfram Language to the corresponding Java classes
- Launching of Mathematica or another Wolfram product and J/Link from within Workbench, allowing debugging of both at the same time
Easily Edit and Navigate Code
Source Code Editor
The source code editor provides powerful source code editing with syntax coloring, error reporting and more. The errors are reported with a Problems window and mouseover usage messages for convenient assistance. Workbench provides extended code and section folding, improved code hover and the ability to search for references to a symbol. Some of the important features of the source code editor include:
- Code folding
- Code outline
- Command completion and templates
- Error reporting
- Quick assists such as symbol renaming
- Function definition search
- Syntax coloring
- Bracket highlighting
- Text hover with usage information
Text and Pattern Searching
Workbench supplements text searching with pattern searching, which lets you find certain structures in your code. For example, the pattern If[_, _] can be used to find every instance of Wolfram Language code in your workspace that has an If with two arguments. It also provides scripting of warnings and error markers based on Wolfram Language patterns.
Source and Notebook Comparison
You can use both the source and compare editors in Mathematica or another Wolfram product to view notebooks with linear syntax removed. This makes structural comparisons of notebooks very easy, which is useful when using version control systems or just for local comparison of two notebooks.
Use Robust Debugging Tools
Debugging
The debugger is one of the key features of Wolfram Workbench. One of the prime benefits is the ability to use different breakpoint types and watch expressions to study your code as it runs, so that you can detect and fix any problems.
Profiling
The Workbench profiler allows you to see details of the execution of your Wolfram Language functions. Seeing the number of evaluations and time spent on parts of your code can highlight areas that will yield the highest return for optimization efforts.
Unit Tester
The Workbench tester performs unit testing for your code, with useful features for writing and running tests. The tester produces a report that tells you whether all tests have passed, lists any that failed and gives links from the report to the actual tests in the test file.
Manage and Deploy Projects
Project-Based Workflow
Wolfram Workbench allows you to group your application and all associated resources, such as test files, in a single container called a project. Many different types of resources are supported, including Wolfram Language source code and notebooks, Java classes and libraries and database connection information.
There is a range of tools for working with resources. Wolfram Language pattern-based searching and browsing tools, along with fast find for packages or functions, make navigating your code easier and faster than ever.
Project Deployment
Using the Workbench export wizards, you can deploy your projects locally or package them for delivery. All content types are supported, including documentation, ensuring that you deploy your latest development work.
Version Control
Version control of projects is an essential aspect of modern software development. Workbench provides full-featured integration with the Git version control system without the need to install and configure any additional tools on your system. Workbench also supports many other version control systems, such as CVS and Subversion, either with built-in support or via easy installation of additional tools.
Write Documentation
Documentation Builder
Wolfram Workbench now includes a full set of tools for developing and integrating documentation for your application into your Wolfram Language Documentation Center. For example, you could easily integrate your application's function, guide and tutorial pages with existing Wolfram Language documentation.
Q&A
Which Wolfram products does Workbench work with?
Workbench works with Mathematica, Wolfram Desktop, Wolfram Finance Platform, gridMathematica and webMathematica.
What do I need to install to use Workbench?
To use Workbench, you need to have installed Mathematica or any other Workbench-compatible Wolfram product.
What technologies are used in Workbench?
Workbench is a powerful Eclipse plugin for Wolfram Language. It makes heavy use of J/Link, the Wolfram Language toolkit that provides transparent communication between Wolfram Language and Java.
What is Eclipse?
Eclipse is a highly customizable platform and a leading integrated development environment for programming. Eclipse is platform independent and is built around an extension mechanism involving modules known as plugins. Eclipse has a very large number of free and commercial plugins available for carrying out a variety of different tasks. This includes support for languages such as Java, C, C++ and Fortran, as well as support for such things as HTML, XML and many web technologies. More information on available plugins is at the Eclipse Marketplace.
How does Workbench use Eclipse?
Wolfram Workbench is a Wolfram-branded plugin for Eclipse. You can install the Workbench plugin into a standalone copy of Eclipse.
How can I get the Workbench plugin?
For details on how to obtain and install the plugin, visit our Technical Support Quick Answers page.
What versions of Eclipse are supported?
Wolfram Workbench requires Eclipse 4.6 (Neon) or later and Java Runtime Environment (JRE) 8. We recommend using the latest version of Eclipse and Java.
If I am running a multi-language development project, can I use Workbench to manage the workflow?
Yes, Workbench can be very useful for multi-language development, due to the wide range of plugins available for Eclipse.
What platforms does Workbench support?
Workbench supports Windows, macOS and Linux.
What versions of Wolfram Language are supported by Workbench?
Workbench supports products based on Wolfram Language Versions 10 and later.