The Wolfram Solution for Actuarial Sciences
Design predictive or data modeling tools for insurance claims, instantly analyze data from Wolfram|Alpha and your spreadsheets and present fully interactive charts and reports—a complete workflow.
Underlying the Wolfram actuarial sciences solution is the integration of statistical and financial computations into a single system, along with syntax-free commands and web or local deployment.
- The Wolfram Edge
- How Wolfram Compares
- Key Capabilities
Wolfram technologies include thousands of built-in functions and curated data on many topics that let you:
- Import life tables or other spreadsheets and easily do complex calculations
- Calculate present values of expected premiums or benefits to set pricing for insurance policies
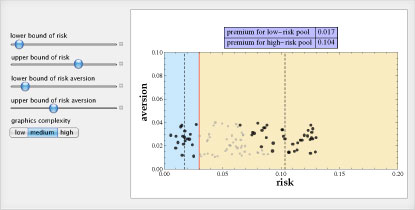
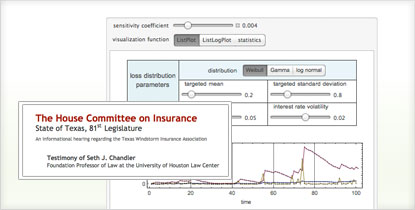
- Create interactive tools for quick calculations or presentations and deploy them to others with Wolfram Player or webMathematica
- Visualize your data in any way you choose, including creating interactive plots
- Compare possible premiums and payments of several policies
- Predict the number of events or survivors with built-in Nelson-Aalen and Kaplan-Meier estimators
- Rapidly design policies to meet regulatory demands
- Develop operational predictive modeling tools to improve handling of key aspects of some common property and automobile insurance claims
Does your current tool set have these advantages?
-
Gain accuracy and reliability for your premium and payout calculations by performing symbolic computations, not just numeric ones
Excel and statistical packages have built-in routines that only handle numeric calculations -
Ensure accurate results in probability and financial calculations with fully automated precision control and arbitrary-precision arithmetic
All systems like Excel or statistics programs that rely on machine arithmetic can show critical errors due to numerical accuracy failure -
Create highly customized, presentation-quality visualizations, including line graphs, bar charts and scatter plots, to share results with others
SPSS requires explicit programming for customized charts -
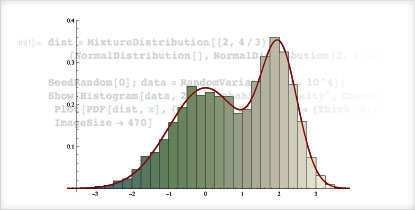
Work with 35 properties of 100 new distributions with specialized coverage for insurance and finance
The Wolfram Language has more built-in distributions than any other system - Refer to interactive examples specific to actuarial science and insurance in the documentation
- Import, analyze and deliver results in one interactive document instead of across several applications
Actuarial sciences specific capabilities:
- Built-in statistical analysis tools, standard probability distributions and dispersion measures for calculating risks and cumulative probabilities »
- Built-in distributions for mortality, claim frequency and other actuarial science and insurance applications: Gompertz–Makeham, Weibull, Benktander–Gibrat, beta binomal, logarithmic series and more »
- The most advanced symbolic and numeric calculus system, including numeric integration and other capabilities for calculating expected insurance losses and payments »
- Choose from a variety of built-in, standard statistical charts and graphs or create highly customizable, interactive plots »
- Access terabytes of Wolfram|Alpha's demographic, economic and geographic data for your computations and combine it with data imported in all common data formats, including XML, XLS, CSV and TSV
- Symbolic and numeric superfunctions automatically compute the probability of any event and the expectation of any expression for any univariate or multivariate distribution, allowing quick calculations for many problems
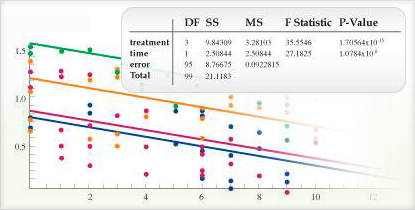
- Linear, nonlinear, logit, probit and generalized linear regression models with properties and diagnostics for goodness of fit, parameter estimates and more »
- Descriptive statistics for univariate and multivariate data »
- Univariate analysis of variance (ANOVA) and post-hoc tests for comparisons to examine survival models with interdependent parameters »
- Integrate with Microsoft Excel with Mathematica Link for Excel »
- Calculate with built-in traditional mathematical notation that can be extended with standard actuarial notation
- Built-in symbolic and numeric time-value-of-money computations and interest rate calculations for continuous or discrete time processes and term structures, plus Wolfram Finance Platform's additional finance-specific tools and real-time data access

Organizations Using Wolfram Technologies


Consulting Solutions
Enlist the world’s computation experts to help with your project—any size, any level. At Wolfram, we know what’s possible with computational technology because we are global leaders in creating it. That gives us an unprecedented depth of expertise in applying it to consulting work in a variety of fields. Whether individual or enterprise, from concept to deployment, our computation experts can help you achieve robust results with less time and effort. Get us started with your project today