Temperature MinMax
With the new function MinMax, the minimum and maximum values of a list can now be extracted at the same time.
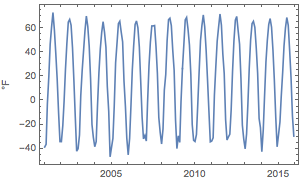
A temperature dataset for the city of Yakutsk over a period of 15 years is generated.
In[1]:=
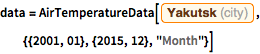
data = AirTemperatureData[
  Entity["City", {"Yakutsk", "Yakutia", "Russia"}], {{2001,
    01}, {2015, 12}, "Month"}]
Out[1]=
The resulting time series can be visualized with DateListPlot.
In[2]:=
DateListPlot[data, FrameLabel -> Automatic]Out[2]=
These are the maximum and minimum temperatures over the period of 15 years.
In[3]:=
periodextrema = MinMax[data]Out[3]=
This gives the maximum and minimum temperatures for each year.
In[4]:=
yearextrema =
 MovingMap[MinMax,
  data, {Quantity[1, "Years"], Right, Quantity[1, "Years"]}]
Out[4]=
Extract the extrema values of the first year.
In[5]:=
yearextrema["FirstValue"]Out[5]=
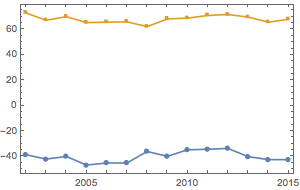
Plot their variations over the period of 15 years.
In[6]:=
DateListPlot[yearextrema, PlotMarkers -> Automatic]Out[6]=