最高気温と最低気温
新関数のMinMaxを使うと,リストの最大値と最小値を同時に取り出すことができる.
ヤクーツク市の15年間の気温データ集合を生成する.
In[1]:=
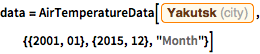
data = AirTemperatureData[
  Entity["City", {"Yakutsk", "Yakutia", "Russia"}], {{2001,
    01}, {2015, 12}, "Month"}]
Out[1]=
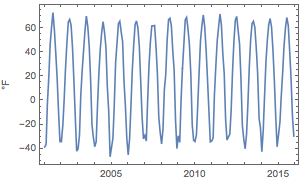
結果の時系列はDateListPlotを使って可視化することができる.
In[2]:=
DateListPlot[data, FrameLabel -> Automatic]Out[2]=
以下は,15年間における最高気温と最低気温である.
In[3]:=
periodextrema = MinMax[data]Out[3]=
次は,各年の最高気温と最低気温を与える.
In[4]:=
yearextrema =
 MovingMap[MinMax,
  data, {Quantity[1, "Years"], Right, Quantity[1, "Years"]}]
Out[4]=
最初の年の極値を取り出す.
In[5]:=
yearextrema["FirstValue"]Out[5]=
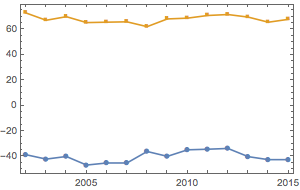
15年間の変化をプロットする.
In[6]:=
DateListPlot[yearextrema, PlotMarkers -> Automatic]Out[6]=