Create Histograms from Weighted Locations
For each of the 50 busiest airports in Europe, weight the location of the airport with the number of passengers it serves.
In[1]:=
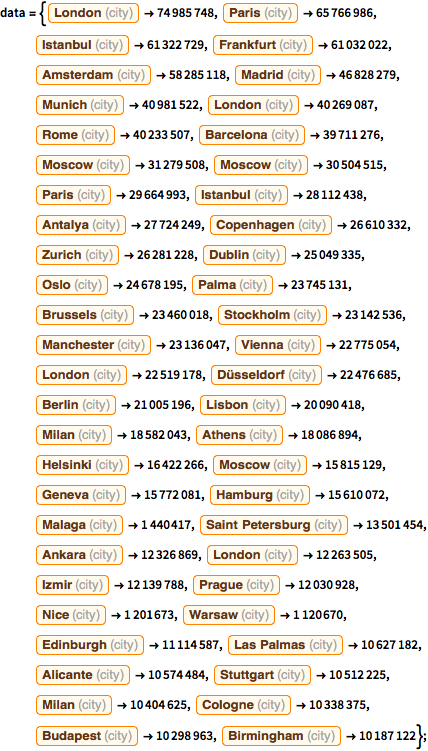
data = {Entity[
"City", {"London", "GreaterLondon", "UnitedKingdom"}] ->
74985748,
Entity["City", {"Paris", "IleDeFrance", "France"}] -> 65766986,
Entity["City", {"Istanbul", "Istanbul", "Turkey"}] -> 61322729,
Entity["City", {"Frankfurt", "Hesse", "Germany"}] -> 61032022,
Entity["City", {"Amsterdam", "NoordHolland", "Netherlands"}] ->
58285118,
Entity["City", {"Madrid", "Madrid", "Spain"}] -> 46828279,
Entity["City", {"Munich", "Bavaria", "Germany"}] -> 40981522,
Entity["City", {"London", "GreaterLondon", "UnitedKingdom"}] ->
40269087, Entity["City", {"Rome", "Lazio", "Italy"}] -> 40233507,
Entity["City", {"Barcelona", "Barcelona", "Spain"}] -> 39711276,
Entity["City", {"Moscow", "Moscow", "Russia"}] -> 31279508,
Entity["City", {"Moscow", "Moscow", "Russia"}] -> 30504515,
Entity["City", {"Paris", "IleDeFrance", "France"}] -> 29664993,
Entity["City", {"Istanbul", "Istanbul", "Turkey"}] -> 28112438,
Entity["City", {"Antalya", "Antalya", "Turkey"}] -> 27724249,
Entity["City", {"Copenhagen", "Copenhagen", "Denmark"}] ->
26610332,
Entity["City", {"Zurich", "Zurich", "Switzerland"}] -> 26281228,
Entity["City", {"Dublin", "Dublin", "Ireland"}] -> 25049335,
Entity["City", {"Oslo", "Oslo", "Norway"}] -> 24678195,
Entity["City", {"Palma", "Balears", "Spain"}] -> 23745131,
Entity["City", {"Brussels", "Brussels", "Belgium"}] -> 23460018,
Entity["City", {"Stockholm", "Stockholm", "Sweden"}] -> 23142536,
Entity["City", {"Manchester", "Manchester", "UnitedKingdom"}] ->
23136047,
Entity["City", {"Vienna", "Vienna", "Austria"}] -> 22775054,
Entity["City", {"London", "GreaterLondon", "UnitedKingdom"}] ->
22519178,
Entity["City", {"Dusseldorf", "NorthRhineWestphalia",
"Germany"}] -> 22476685,
Entity["City", {"Berlin", "Berlin", "Germany"}] -> 21005196,
Entity["City", {"Lisbon", "Lisboa", "Portugal"}] -> 20090418,
Entity["City", {"Milan", "Lombardy", "Italy"}] -> 18582043,
Entity["City", {"Athens", "Attiki", "Greece"}] -> 18086894,
Entity["City", {"Helsinki", "Uusimaa", "Finland"}] -> 16422266,
Entity["City", {"Moscow", "Moscow", "Russia"}] -> 15815129,
Entity["City", {"Geneva", "Geneva", "Switzerland"}] -> 15772081,
Entity["City", {"Hamburg", "Hamburg", "Germany"}] -> 15610072,
Entity["City", {"Malaga", "Malaga", "Spain"}] -> 1440417,
Entity["City", {"SaintPetersburg", "SaintPetersburg", "Russia"}] ->
13501454,
Entity["City", {"Ankara", "Ankara", "Turkey"}] -> 12326869,
Entity["City", {"London", "GreaterLondon", "UnitedKingdom"}] ->
12263505,
Entity["City", {"Izmir", "Izmir", "Turkey"}] -> 12139788,
Entity["City", {"Prague", "Prague", "CzechRepublic"}] -> 12030928,
Entity["City", {"Nice", "ProvenceAlpesCoteDAzur", "France"}] ->
1201673,
Entity["City", {"Warsaw", "Mazowieckie", "Poland"}] -> 1120670,
Entity["City", {"Edinburgh", "Edinburgh", "UnitedKingdom"}] ->
11114587,
Entity["City", {"LasPalmas", "LasPalmas", "Spain"}] -> 10627182,
Entity["City", {"Alicante", "Alacant", "Spain"}] -> 10574484,
Entity["City", {"Stuttgart", "BadenWurttemberg", "Germany"}] ->
10512225,
Entity["City", {"Milan", "Lombardy", "Italy"}] -> 10404625,
Entity["City", {"Cologne", "NorthRhineWestphalia", "Germany"}] ->
10338375,
Entity["City", {"Budapest", "Budapest", "Hungary"}] -> 10298963,
Entity["City", {"Birmingham", "Birmingham", "UnitedKingdom"}] ->
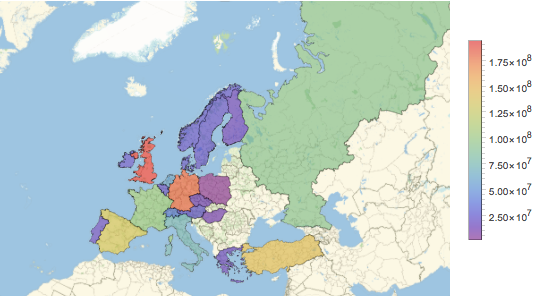
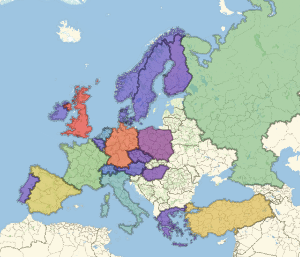
10187122};Create a histogram by summing the total passengers for all the airports in each country.
In[2]:=
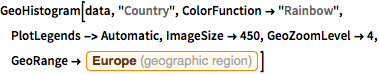
GeoHistogram[data, "Country", ColorFunction -> "Rainbow",
 PlotLegends -> Automatic, ImageSize -> 450, GeoZoomLevel -> 4,
 GeoRange -> Entity["GeographicRegion", "Europe"]]
Out[2]=