Projected Grid of Latitude and Longitude Lines
This function draws the full grid of parallels and meridians (in red and blue, respectively) after being projected with a geo projection.
In[1]:=
graticule[proj_] :=
With[{centering = {0, 0, 1.5},
diff = Quantity[10, "AngularDegrees"]},
Framed[Labeled[
GeoGraphics[GeoRange -> "World",
GeoProjection -> {proj, "Centering" -> centering},
GeoGridLines -> diff, GeoGridLinesStyle -> {Red, Blue},
GeoBackground -> None, PlotRangePadding -> Scaled[0.1]], proj]]
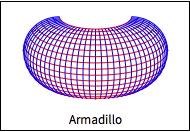
]These are three examples.
In[2]:=
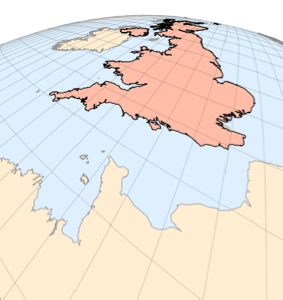
graticule["Armadillo"]Out[2]=
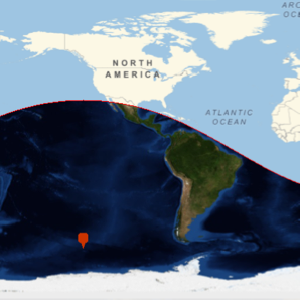
In[3]:=
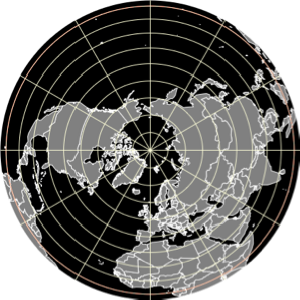
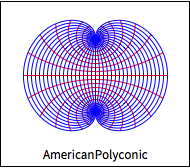
graticule["AmericanPolyconic"]Out[3]=
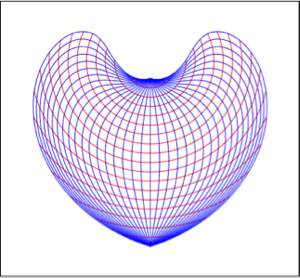
In[4]:=
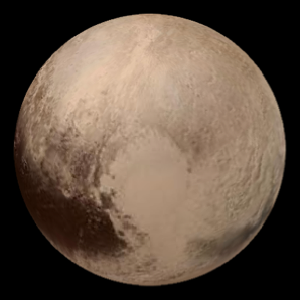
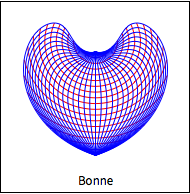
graticule["Bonne"]Out[4]=
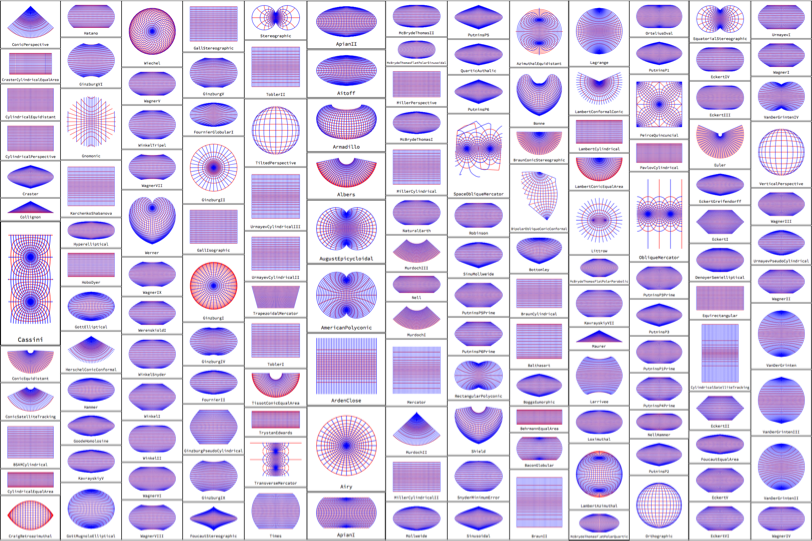
Compute the latitude-longitude grids for all 151 projections with a spherical reference model.
In[5]:=
plots = graticule /@ GeoProjectionData["Spherical"];Rasterize them using a small enough image size.
In[6]:=
images = Rasterize[#, ImageSize -> 200] & /@ plots;Construct an image collage.
In[7]:=
ImageCollage[images]Out[7]=