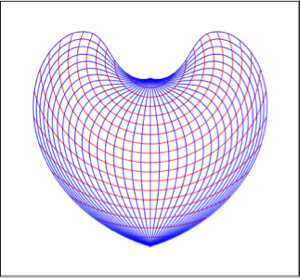
Rejilla proyectada de líneas de latitud y longitud
Esta función traza la rejilla completa de paralelos y meridianos (en rojo y azul, respectivamente) luego de ser proyectadas con una proyección geográfica.
In[1]:=
graticule[proj_] :=
 With[{centering = {0, 0, 1.5},
   diff = Quantity[10, "AngularDegrees"]},
  Framed[Labeled[
    GeoGraphics[GeoRange -> "World",
     GeoProjection -> {proj, "Centering" -> centering},
     GeoGridLines -> diff, GeoGridLinesStyle -> {Red, Blue},
     GeoBackground -> None, PlotRangePadding -> Scaled[0.1]], proj]]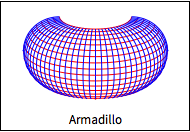
]Éstos son tres ejemplos.
In[2]:=
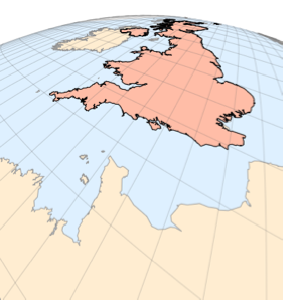
graticule["Armadillo"]Out[2]=
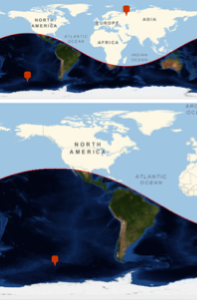
In[3]:=
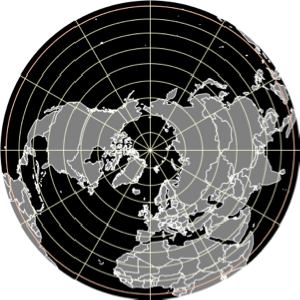
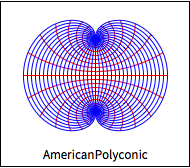
graticule["AmericanPolyconic"]Out[3]=
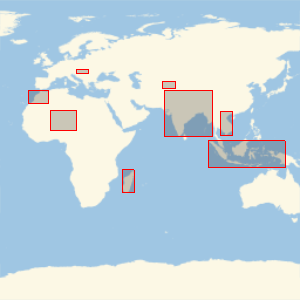
In[4]:=
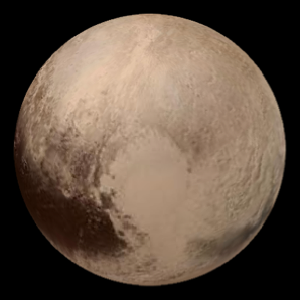
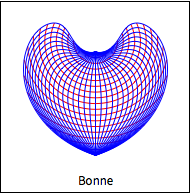
graticule["Bonne"]Out[4]=
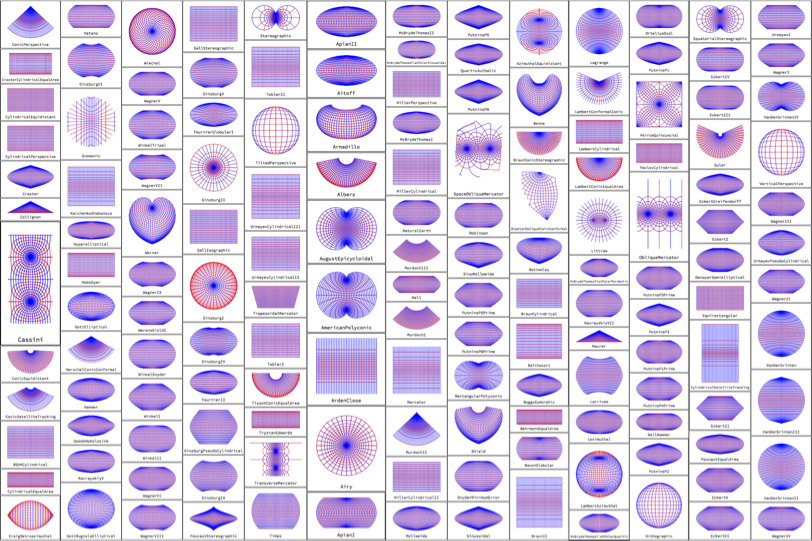
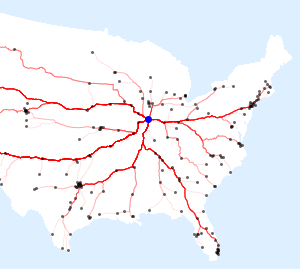
Calcule la rejilla de latitud-longitud para todas las 151 proyecciones con un modelo esférico de referencia.
In[5]:=
plots = graticule /@ GeoProjectionData["Spherical"];Rasterícelos usando tamaño de imagen lo suficientemente pequeño.
In[6]:=
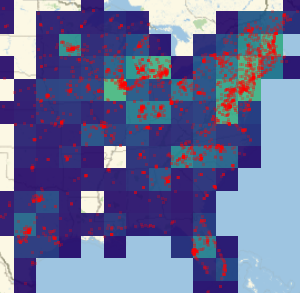
images = Rasterize[#, ImageSize -> 200] & /@ plots;Construya un collage de imágenes.
In[7]:=
ImageCollage[images]Out[7]=