Analysieren Sie ein Trending Topic auf Twitter
Stellen Sie eine Verbindung zur Twitter-API her.
In[1]:=
tw = ServiceConnect["Twitter"]Out[1]=
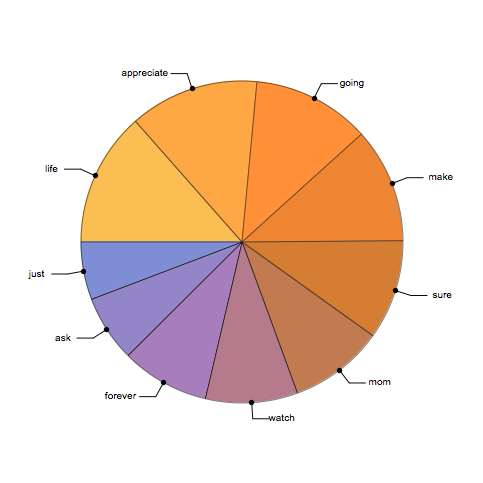
Am Vatertag haben wir den Hashtag-Trend #ThingsMyDadWouldSay verfolgt, um die 10 am meisten verwendeten Wörter in 1000 Tweets zu analysieren.
In[2]:=
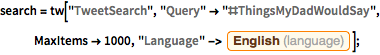
search = tw["TweetSearch", "Query" -> "#ThingsMyDadWouldSay",
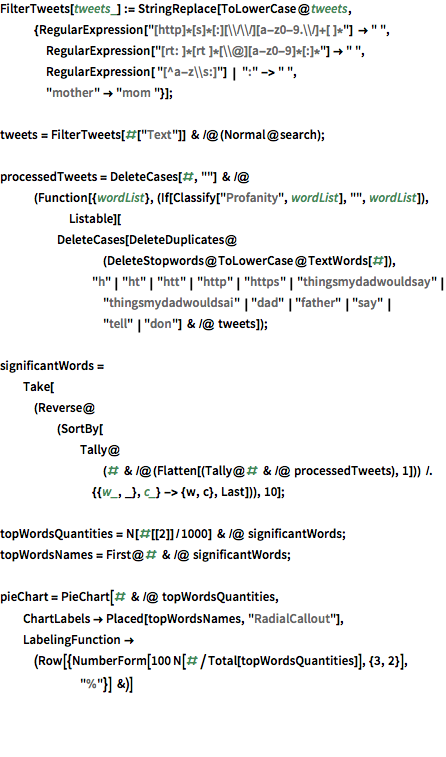
MaxItems -> 1000, "Language" -> Entity["Language", "English"]];Nun verarbeiten wir die Ergebnisse, indem wir unerwünschte Zeichen, Stoppwörter und vulgäre Ausdrücke mithilfe eingebauter Funktionen entfernen. So können wir ein Tortendiagramm der häufigsten Wörter erstellen.
Den kompletten Wolfram Language-Input zeigen
In[4]:=
\!\(\*
GraphicsBox[{{}, {},
DynamicModuleBox[{DynamicChart`click$240228$240326 = False,
     DynamicChart`click$240238$240326 = False,
     DynamicChart`click$240243$240326 = False,
     DynamicChart`click$240248$240326 = False,
     DynamicChart`click$240253$240326 = False,
     DynamicChart`click$240258$240326 = False,
     DynamicChart`click$240263$240326 = False,
     DynamicChart`click$240268$240326 = False,
     DynamicChart`click$240273$240326 = False,
     DynamicChart`click$240278$240326 = False}, {
{RGBColor[0.5, 0.5, 1.], EdgeForm[{GrayLevel[0], Opacity[
       0.5]}], {{{}, {
{RGBColor[0.982864, 0.7431472, 0.3262672], EdgeForm[{GrayLevel[0],
           Opacity[0.5]}], GeometricTransformationBox[
TagBox[
TagBox[
TooltipBox[
TagBox[{
DynamicBox[{
FEPrivate`If[
CurrentValue["MouseOver"],
EdgeForm[{
GrayLevel[0.5],
AbsoluteThickness[2.5],
Opacity[0.66]}], {}, {}],
DiskBox[{0, 0}, 1., {2.2936049193303374`, 3.141592653589793}]},
ImageSizeCache->{{79.08578643762692,

                   242.9142135623731}, {-124.65629614843725`, \
-1.0857864376268935`}}], {}},
StatusArea[#,
Row[{
NumberForm[13.496143958868895`, {3, 2}], "%"}]]& ,
TagBoxNote->"Row[{NumberForm[13.496143958868895, {3, 2}], \"%\"}]"],
StyleBox[
TemplateBox[{
TagBox[
InterpretationBox[
                   "\"13.50\"", 13.496143958868895`,
                    AutoDelete -> True], NumberForm[#, {3, 2}]& ],
                  "\"%\""}, "RowDefault"], {
GrayLevel[0], FontFamily -> "Arial"}, StripOnInput -> False]],
Annotation[#,
Style[
Row[{
NumberForm[13.496143958868895`, {3, 2}], "%"}], {
GrayLevel[0], FontFamily -> "Arial"}], "Tooltip"]& ],
EventHandlerTag[{
              "MouseClicked" :> FEPrivate`Set[
                DynamicChart`click$240228$240326,
FEPrivate`Not[DynamicChart`click$240228$240326]],
               PassEventsDown -> True, Method -> "Preemptive",
               PassEventsUp -> True}]], Dynamic[
            If[DynamicChart`click$240228$240326, {{{1., 0}, {
                0, 1.}}, {-0.18229062425038137`,
               0.08228078943718442}}, {{1, 0}, {0, 1}}, {{1, 0}, {0,
              1}}],
             TrackedSymbols :> {
              DynamicChart`click$240228$240326}]]},
{RGBColor[0.99048, 0.6546373333333334, 0.2701484444444444], EdgeForm[{
           GrayLevel[0], Opacity[0.5]}], GeometricTransformationBox[
TagBox[
TagBox[
TooltipBox[
TagBox[{
DynamicBox[{
FEPrivate`If[
CurrentValue["MouseOver"],
EdgeForm[{
GrayLevel[0.5],
AbsoluteThickness[2.5],
Opacity[0.66]}], {}, {}],
DiskBox[{0, 0}, 1., {1.4779214797093372`, 2.2936049193303374`}]},
ImageSizeCache->{{133.58531933639745`,
                   257.8455766527461}, {-164.91421356237305`, \
-1.0857864376268935`}}], {}},
StatusArea[#,
Row[{
NumberForm[12.982005141388175`, {3, 2}], "%"}]]& ,
TagBoxNote->"Row[{NumberForm[12.982005141388175, {3, 2}], \"%\"}]"],
StyleBox[
TemplateBox[{
TagBox[
InterpretationBox[
                   "\"13.00\"", 12.982005141388175`,
                    AutoDelete -> True], NumberForm[#, {3, 2}]& ],
                  "\"%\""}, "RowDefault"], {
GrayLevel[0], FontFamily -> "Arial"}, StripOnInput -> False]],
Annotation[#,
Style[
Row[{
NumberForm[12.982005141388175`, {3, 2}], "%"}], {
GrayLevel[0], FontFamily -> "Arial"}], "Tooltip"]& ],
EventHandlerTag[{
              "MouseClicked" :> FEPrivate`Set[
                DynamicChart`click$240238$240326,
FEPrivate`Not[DynamicChart`click$240238$240326]],
               PassEventsDown -> True, Method -> "Preemptive",
               PassEventsUp -> True}]], Dynamic[
            If[DynamicChart`click$240238$240326, {{{1., 0}, {
                0, 1.}}, {-0.061956994752888045`,
               0.19016132835356037`}}, {{1, 0}, {0, 1}}, {{1, 0}, {0,
              1}}], TrackedSymbols :> {
              DynamicChart`click$240238$240326}]]},
{RGBColor[0.998096, 0.5661274666666667, 0.2140296888888889],
           EdgeForm[{GrayLevel[0], Opacity[0.5]}],
           GeometricTransformationBox[
TagBox[
TagBox[
TooltipBox[
TagBox[{
DynamicBox[{
FEPrivate`If[
CurrentValue["MouseOver"],
EdgeForm[{
GrayLevel[0.5],
AbsoluteThickness[2.5],
Opacity[0.66]}], {}, {}],
DiskBox[{0, 0}, 1., {0.7349227030248611, 1.4779214797093372`}]},
ImageSizeCache->{{240.0857864376269,
                   362.35730983508927`}, {-164.22034069500467`, \
-1.0857864376268935`}}], {}},
StatusArea[#,
Row[{
NumberForm[11.825192802056556`, {3, 2}], "%"}]]& ,
TagBoxNote->"Row[{NumberForm[11.825192802056556, {3, 2}], \"%\"}]"],
StyleBox[
TemplateBox[{
TagBox[
InterpretationBox[
                   "\"11.80\"", 11.825192802056556`,
                    AutoDelete -> True], NumberForm[#, {3, 2}]& ],
                  "\"%\""}, "RowDefault"], {
GrayLevel[0], FontFamily -> "Arial"}, StripOnInput -> False]],
Annotation[#,
Style[
Row[{
NumberForm[11.825192802056556`, {3, 2}], "%"}], {
GrayLevel[0], FontFamily -> "Arial"}], "Tooltip"]& ],
EventHandlerTag[{
              "MouseClicked" :> FEPrivate`Set[
                DynamicChart`click$240243$240326,
FEPrivate`Not[DynamicChart`click$240243$240326]],
               PassEventsDown -> True, Method -> "Preemptive",
               PassEventsUp -> True}]], Dynamic[
            If[DynamicChart`click$240243$240326, {{{1., 0}, {
                0, 1.}}, {0.08957267836310434,
               0.17882039953780404`}}, {{1, 0}, {0, 1}}, {{1, 0}, {0,
              1}}],
             TrackedSymbols :> {
              DynamicChart`click$240243$240326}]]},
{RGBColor[0.928, 0.5210666666666667, 0.2], EdgeForm[{GrayLevel[0],
           Opacity[0.5]}], GeometricTransformationBox[
TagBox[
TagBox[
TooltipBox[
TagBox[{
DynamicBox[{
FEPrivate`If[
CurrentValue["MouseOver"],
EdgeForm[{
GrayLevel[0.5],
AbsoluteThickness[2.5],
Opacity[0.66]}], {}, {}],
DiskBox[{0, 0}, 1., {0.008076073659613492, 0.7349227030248611}]},
ImageSizeCache->{{240.0857864376269,
                   403.9089631421672}, {-111.86951335254854`, \
-1.0857864376268935`}}], {}},
StatusArea[#,
Row[{
NumberForm[11.568123393316196`, {3, 2}], "%"}]]& ,
TagBoxNote->"Row[{NumberForm[11.568123393316196, {3, 2}], \"%\"}]"],
StyleBox[
TemplateBox[{
TagBox[
InterpretationBox[
                   "\"11.60\"", 11.568123393316196`,
                    AutoDelete -> True], NumberForm[#, {3, 2}]& ],
                  "\"%\""}, "RowDefault"], {
GrayLevel[0], FontFamily -> "Arial"}, StripOnInput -> False]],
Annotation[#,
Style[
Row[{
NumberForm[11.568123393316196`, {3, 2}], "%"}], {
GrayLevel[0], FontFamily -> "Arial"}], "Tooltip"]& ],
EventHandlerTag[{
              "MouseClicked" :> FEPrivate`Set[
                DynamicChart`click$240248$240326,
FEPrivate`Not[DynamicChart`click$240248$240326]],
               PassEventsDown -> True, Method -> "Preemptive",
               PassEventsUp -> True}]], Dynamic[
            If[DynamicChart`click$240248$240326, {{{1., 0}, {
                0, 1.}}, {0.1863568191666578,
               0.07260258914174895}}, {{1, 0}, {0, 1}}, {{1, 0}, {0,
              1}}], TrackedSymbols :> {
              DynamicChart`click$240248$240326}]]},
{RGBColor[0.8320000000000001, 0.49048888888888886`, 0.2], EdgeForm[{
           GrayLevel[0], Opacity[0.5]}], GeometricTransformationBox[
TagBox[
TagBox[
TooltipBox[
TagBox[{
DynamicBox[{
FEPrivate`If[
CurrentValue["MouseOver"],
EdgeForm[{
GrayLevel[0.5],
AbsoluteThickness[2.5],
Opacity[0.66]}], {}, {}],
DiskBox[{0, 0}, 1., {-0.6218576717902677, 0.008076073659613492}]},
ImageSizeCache->{{240.0857864376269,
                   403.9142135623731}, {-5.214447287280038,
                   92.70413182374841}}], {}},
StatusArea[#,
Row[{
NumberForm[10.025706940874036`, {3, 2}], "%"}]]& ,
TagBoxNote->"Row[{NumberForm[10.025706940874036, {3, 2}], \"%\"}]"],
StyleBox[
TemplateBox[{
TagBox[
InterpretationBox[
                   "\"10.00\"", 10.025706940874036`,
                    AutoDelete -> True], NumberForm[#, {3, 2}]& ],
                  "\"%\""}, "RowDefault"], {
GrayLevel[0], FontFamily -> "Arial"}, StripOnInput -> False]],
Annotation[#,
Style[
Row[{
NumberForm[10.025706940874036`, {3, 2}], "%"}], {
GrayLevel[0], FontFamily -> "Arial"}], "Tooltip"]& ],
EventHandlerTag[{
              "MouseClicked" :> FEPrivate`Set[
                DynamicChart`click$240253$240326,
FEPrivate`Not[DynamicChart`click$240253$240326]],
               PassEventsDown -> True, Method -> "Preemptive",
               PassEventsUp -> True}]], Dynamic[
            If[DynamicChart`click$240253$240326, {{{1., 0}, {
                0, 1.}}, {
               0.19065549075847232`, -0.060419234053785235`}}, {{1,
              0}, {0, 1}}, {{1, 0}, {0, 1}}],
             TrackedSymbols :> {
              DynamicChart`click$240253$240326}]]},
{RGBColor[0.7598801777777778, 0.4773333333333333, 0.3161064888888889],
            EdgeForm[{GrayLevel[0], Opacity[0.5]}],
           GeometricTransformationBox[
TagBox[
TagBox[
TooltipBox[
TagBox[{
DynamicBox[{
FEPrivate`If[
CurrentValue["MouseOver"],
EdgeForm[{
GrayLevel[0.5],
AbsoluteThickness[2.5],
Opacity[0.66]}], {}, {}],
DiskBox[{0, 0}, 1., {-1.2194871226016941`, -0.6218576717902677}]},
ImageSizeCache->{{240.0857864376269,
                   373.7746400958539}, {-3.914213562373078,
                   150.0808140956318}}], {}},
StatusArea[#,
Row[{
NumberForm[9.511568123393316, {3, 2}], "%"}]]& ,
TagBoxNote->"Row[{NumberForm[9.511568123393316, {3, 2}], \"%\"}]"],
StyleBox[
TemplateBox[{
TagBox[
InterpretationBox["\"9.51\"", 9.511568123393316, AutoDelete -> True],
                   NumberForm[#, {3, 2}]& ], "\"%\""}, "RowDefault"], {
GrayLevel[0], FontFamily -> "Arial"}, StripOnInput -> False]],
Annotation[#,
Style[
Row[{
NumberForm[9.511568123393316, {3, 2}], "%"}], {
GrayLevel[0], FontFamily -> "Arial"}], "Tooltip"]& ],
EventHandlerTag[{
              "MouseClicked" :> FEPrivate`Set[
                DynamicChart`click$240258$240326,
FEPrivate`Not[DynamicChart`click$240258$240326]],
               PassEventsDown -> True, Method -> "Preemptive",
               PassEventsUp -> True}]], Dynamic[
            If[DynamicChart`click$240258$240326, {{{1., 0}, {
                0, 1.}}, {
               0.12105701188685061`, -0.15920175838547423`}}, {{1,
              0}, {0, 1}}, {{1, 0}, {0, 1}}],
             TrackedSymbols :> {
              DynamicChart`click$240258$240326}]]},
{RGBColor[0.7116405333333333, 0.4816, 0.5483194666666666], EdgeForm[{
           GrayLevel[0], Opacity[0.5]}], GeometricTransformationBox[
TagBox[
TagBox[
TooltipBox[
TagBox[{
DynamicBox[{
FEPrivate`If[
CurrentValue["MouseOver"],
EdgeForm[{
GrayLevel[0.5],
AbsoluteThickness[2.5],
Opacity[0.66]}], {}, {}],
DiskBox[{0, 0}, 1., {-1.8009644260938913`, -1.2194871226016941`}]},
ImageSizeCache->{{203.35505437237913`,
                   298.31871593553933`}, {-3.914213562373078,
                   159.91421356237308`}}], {}},
StatusArea[#,
Row[{
NumberForm[9.254498714652955, {3, 2}], "%"}]]& ,
TagBoxNote->"Row[{NumberForm[9.254498714652955, {3, 2}], \"%\"}]"],
StyleBox[
TemplateBox[{
TagBox[
InterpretationBox["\"9.25\"", 9.254498714652955, AutoDelete -> True],
                   NumberForm[#, {3, 2}]& ], "\"%\""}, "RowDefault"], {
GrayLevel[0], FontFamily -> "Arial"}, StripOnInput -> False]],
Annotation[#,
Style[
Row[{
NumberForm[9.254498714652955, {3, 2}], "%"}], {
GrayLevel[0], FontFamily -> "Arial"}], "Tooltip"]& ],
EventHandlerTag[{
              "MouseClicked" :> FEPrivate`Set[
                DynamicChart`click$240263$240326,
FEPrivate`Not[DynamicChart`click$240263$240326]],
               PassEventsDown -> True, Method -> "Preemptive",
               PassEventsUp -> True}]], Dynamic[
            If[DynamicChart`click$240263$240326, {{{1., 0}, {
                0, 1.}}, {
               0.012106704489852273`, -0.19963323297085434`}}, {{1,
              0}, {0, 1}}, {{1, 0}, {0, 1}}],
             TrackedSymbols :> {
              DynamicChart`click$240263$240326}]]},
{RGBColor[0.6558762666666667, 0.4926222222222222, 0.7345293333333333],
            EdgeForm[{GrayLevel[0], Opacity[0.5]}],
           GeometricTransformationBox[
TagBox[
TagBox[
TooltipBox[
TagBox[{
DynamicBox[{
FEPrivate`If[
CurrentValue["MouseOver"],
EdgeForm[{
GrayLevel[0.5],
AbsoluteThickness[2.5],
Opacity[0.66]}], {}, {}],
DiskBox[{0, 0}, 1., {-2.358213508607249, -1.8009644260938913`}]},
ImageSizeCache->{{126.01197334230658`,
                   242.9142135623731}, {-3.914213562373078,
                   155.66833096268567`}}], {}},
StatusArea[#,
Row[{
NumberForm[8.868894601542419, {3, 2}], "%"}]]& ,
TagBoxNote->"Row[{NumberForm[8.868894601542419, {3, 2}], \"%\"}]"],
StyleBox[
TemplateBox[{
TagBox[
InterpretationBox["\"8.87\"", 8.868894601542419, AutoDelete -> True],
                   NumberForm[#, {3, 2}]& ], "\"%\""}, "RowDefault"], {
GrayLevel[0], FontFamily -> "Arial"}, StripOnInput -> False]],
Annotation[#,
Style[
Row[{
NumberForm[8.868894601542419, {3, 2}], "%"}], {
GrayLevel[0], FontFamily -> "Arial"}], "Tooltip"]& ],
EventHandlerTag[{
              "MouseClicked" :> FEPrivate`Set[
                DynamicChart`click$240268$240326,
FEPrivate`Not[DynamicChart`click$240268$240326]],
               PassEventsDown -> True, Method -> "Preemptive",
               PassEventsUp -> True}]], Dynamic[
            If[DynamicChart`click$240268$240326, {{{1., 0}, {
                0, 1.}}, {-0.09742463500061399, \
-0.17466665536099654`}}, {{1, 0}, {0, 1}}, {{1, 0}, {0, 1}}],
             TrackedSymbols :> {
              DynamicChart`click$240268$240326}]]},
{RGBColor[0.5775381333333334, 0.5239111111111111, 0.7827298666666667],
            EdgeForm[{GrayLevel[0], Opacity[0.5]}],
           GeometricTransformationBox[
TagBox[
TagBox[
TooltipBox[
TagBox[{
DynamicBox[{
FEPrivate`If[
CurrentValue["MouseOver"],
EdgeForm[{
GrayLevel[0.5],
AbsoluteThickness[2.5],
Opacity[0.66]}], {}, {}],
DiskBox[{0, 0}, 1., {-2.77816933890717, -2.358213508607249}]},
ImageSizeCache->{{89.60143759192334,
                   242.9142135623731}, {-3.9142135623731065`,
                   112.52831993078988`}}], {}},
StatusArea[#,
Row[{
NumberForm[6.683804627249357, {3, 2}], "%"}]]& ,
TagBoxNote->"Row[{NumberForm[6.683804627249357, {3, 2}], \"%\"}]"],
StyleBox[
TemplateBox[{
TagBox[
InterpretationBox["\"6.68\"", 6.683804627249357, AutoDelete -> True],
                   NumberForm[#, {3, 2}]& ], "\"%\""}, "RowDefault"], {
GrayLevel[0], FontFamily -> "Arial"}, StripOnInput -> False]],
Annotation[#,
Style[
Row[{
NumberForm[6.683804627249357, {3, 2}], "%"}], {
GrayLevel[0], FontFamily -> "Arial"}], "Tooltip"]& ],
EventHandlerTag[{
              "MouseClicked" :> FEPrivate`Set[
                DynamicChart`click$240273$240326,
FEPrivate`Not[DynamicChart`click$240273$240326]],
               PassEventsDown -> True, Method -> "Preemptive",
               PassEventsUp -> True}]], Dynamic[
            If[DynamicChart`click$240273$240326, {{{1., 0}, {
                0, 1.}}, {-0.16801213927487046`, \
-0.10849848411974031`}}, {{1, 0}, {0, 1}}, {{1, 0}, {0, 1}}],

             TrackedSymbols :> {
              DynamicChart`click$240273$240326}]]},
{RGBColor[0.4992, 0.5552, 0.8309304], EdgeForm[{GrayLevel[0], Opacity[
           0.5]}], GeometricTransformationBox[
TagBox[
TagBox[
TooltipBox[
TagBox[{
DynamicBox[{
FEPrivate`If[
CurrentValue["MouseOver"],
EdgeForm[{
GrayLevel[0.5],
AbsoluteThickness[2.5],
Opacity[0.66]}], {}, {}],
DiskBox[{0, 0}, 1., {-3.141592653589793, -2.77816933890717}]},
ImageSizeCache->{{79.08578643762692,
                   242.9142135623731}, {-3.9142135623731136`,
                   56.145854745241415`}}], {}},
StatusArea[#,
Row[{
NumberForm[5.784061696658098, {3, 2}], "%"}]]& ,
TagBoxNote->"Row[{NumberForm[5.784061696658098, {3, 2}], \"%\"}]"],
StyleBox[
TemplateBox[{
TagBox[
InterpretationBox["\"5.78\"", 5.784061696658098, AutoDelete -> True],
                   NumberForm[#, {3, 2}]& ], "\"%\""}, "RowDefault"], {
GrayLevel[0], FontFamily -> "Arial"}, StripOnInput -> False]],
Annotation[#,
Style[
Row[{
NumberForm[5.784061696658098, {3, 2}], "%"}], {
GrayLevel[0], FontFamily -> "Arial"}], "Tooltip"]& ],
EventHandlerTag[{
              "MouseClicked" :> FEPrivate`Set[
                DynamicChart`click$240278$240326,
FEPrivate`Not[DynamicChart`click$240278$240326]],
               PassEventsDown -> True, Method -> "Preemptive",
               PassEventsUp -> True}]], Dynamic[
            If[DynamicChart`click$240278$240326, {{{1., 0}, {
                0, 1.}}, {-0.19670716288723017`, \
-0.036142662725049714`}}, {{1, 0}, {0, 1}}, {{1, 0}, {0, 1}}],
             TrackedSymbols :> {
              DynamicChart`click$240278$240326}]]}}}, {}}, {}}, {{{
         GeometricTransformationBox[
TagBox[
TagBox[
TooltipBox[
TagBox[{{}, {{}, {
{GrayLevel[0], Thickness[0.002], Opacity[1],
StyleBox[{
                    LineBox[{{-0.9114531212519068,
                    0.41140394718592205`}, {-1.0025984333770976`,
                    0.4525443419045143}}],
                    LineBox[{{-1.0025984333770976`,
                    0.4525443419045143}, {-1.1025984333770977`,
                    0.4525443419045143}}]},
FontFamily->"Arial"]},
{GrayLevel[0], Opacity[1],
StyleBox[DiskBox[{-0.9114531212519068, 0.41140394718592205},
                    0.016666666666666666],
FontFamily->"Arial"]}, InsetBox[
StyleBox["\<\"life\"\>",
StripOnInput->False,
FontFamily->"Arial",
FontColor->GrayLevel[0],
$CellContext`LineColor -> GrayLevel[0],
$CellContext`FrontFaceColor -> GrayLevel[0],
$CellContext`BackFaceColor -> GrayLevel[0],
$CellContext`GraphicsColor -> GrayLevel[0]], {-1.1390565582271739, 0.4525443419045143},
                   ImageScaled[{1, Rational[1, 2]}]]}}},
StatusArea[#,
Row[{
NumberForm[13.496143958868895`, {3, 2}], "%"}]]& ,
TagBoxNote->"Row[{NumberForm[13.496143958868895, {3, 2}], \"%\"}]"],
StyleBox[
TemplateBox[{
TagBox[
InterpretationBox[
                 "\"13.50\"", 13.496143958868895`,
                  AutoDelete -> True], NumberForm[#, {3, 2}]& ],
                "\"%\""}, "RowDefault"], {
GrayLevel[0], FontFamily -> "Arial"}, StripOnInput -> False]],
Annotation[#,
Style[
Row[{
NumberForm[13.496143958868895`, {3, 2}], "%"}], {
GrayLevel[0], FontFamily -> "Arial"}], "Tooltip"]& ],
EventHandlerTag[{
            "MouseClicked" :> FEPrivate`Set[
              DynamicChart`click$240228$240326,
FEPrivate`Not[DynamicChart`click$240228$240326]],
             PassEventsDown -> True, Method -> "Preemptive",
             PassEventsUp -> True}]], Dynamic[
          If[DynamicChart`click$240228$240326, {{{1., 0}, {
              0, 1.}}, {-0.18229062425038137`,
             0.08228078943718442}}, {{1, 0}, {0, 1}}, {{1, 0}, {0,
            1}}], TrackedSymbols :> {
            DynamicChart`click$240228$240326}]],
         GeometricTransformationBox[
TagBox[
TagBox[
TooltipBox[
TagBox[{{}, {{}, {
{GrayLevel[0], Thickness[0.002], Opacity[1],
StyleBox[{
                    LineBox[{{-0.3097849737644402,
                    0.9508066417678018}, {-0.34076347114088423`,
                    1.0458873059445821`}}],
                    LineBox[{{-0.34076347114088423`,
                    1.0458873059445821`}, {-0.4407634711408842,
                    1.0458873059445821`}}]},
FontFamily->"Arial"]},
{GrayLevel[0], Opacity[1],
StyleBox[DiskBox[{-0.3097849737644402, 0.9508066417678018},
                    0.016666666666666666],
FontFamily->"Arial"]}, InsetBox[
StyleBox["\<\"appreciate\"\>",
StripOnInput->False,
FontFamily->"Arial",
FontColor->GrayLevel[0],
$CellContext`LineColor -> GrayLevel[0],
$CellContext`FrontFaceColor -> GrayLevel[0],
$CellContext`BackFaceColor -> GrayLevel[0],
$CellContext`GraphicsColor -> GrayLevel[0]], {-0.4531548700914618, 1.0458873059445821},
                   ImageScaled[{1, Rational[1, 2]}]]}}},
StatusArea[#,
Row[{
NumberForm[12.982005141388175`, {3, 2}], "%"}]]& ,
TagBoxNote->"Row[{NumberForm[12.982005141388175, {3, 2}], \"%\"}]"],
StyleBox[
TemplateBox[{
TagBox[
InterpretationBox[
                 "\"13.00\"", 12.982005141388175`,
                  AutoDelete -> True], NumberForm[#, {3, 2}]& ],
                "\"%\""}, "RowDefault"], {
GrayLevel[0], FontFamily -> "Arial"}, StripOnInput -> False]],
Annotation[#,
Style[
Row[{
NumberForm[12.982005141388175`, {3, 2}], "%"}], {
GrayLevel[0], FontFamily -> "Arial"}], "Tooltip"]& ],
EventHandlerTag[{
            "MouseClicked" :> FEPrivate`Set[
              DynamicChart`click$240238$240326,
FEPrivate`Not[DynamicChart`click$240238$240326]],
             PassEventsDown -> True, Method -> "Preemptive",
             PassEventsUp -> True}]], Dynamic[
          If[DynamicChart`click$240238$240326, {{{1., 0}, {
              0, 1.}}, {-0.061956994752888045`,
             0.19016132835356037`}}, {{1, 0}, {0, 1}}, {{1, 0}, {0,
            1}}], TrackedSymbols :> {
            DynamicChart`click$240238$240326}]],
         GeometricTransformationBox[
TagBox[
TagBox[
TooltipBox[
TagBox[{{}, {{}, {
{GrayLevel[0], Thickness[0.002], Opacity[1],
StyleBox[{
                    LineBox[{{0.4478633918155217,
                    0.8941019976890201}, {0.49264973099707393`,
                    0.9835121974579222}}],
                    LineBox[{{0.49264973099707393`,
                    0.9835121974579222}, {0.592649730997074,
                    0.9835121974579222}}]},
FontFamily->"Arial"]},
{GrayLevel[0], Opacity[1],
StyleBox[DiskBox[{0.4478633918155217, 0.8941019976890201},
                    0.016666666666666666],
FontFamily->"Arial"]}, InsetBox[
StyleBox["\<\"going\"\>",
StripOnInput->False,
FontFamily->"Arial",
FontColor->GrayLevel[0],
$CellContext`LineColor -> GrayLevel[0],
$CellContext`FrontFaceColor -> GrayLevel[0],
$CellContext`BackFaceColor -> GrayLevel[0],
$CellContext`GraphicsColor -> GrayLevel[0]], {0.6105642666696948, 0.9835121974579222},
                   ImageScaled[{0, Rational[1, 2]}]]}}},
StatusArea[#,
Row[{
NumberForm[11.825192802056556`, {3, 2}], "%"}]]& ,
TagBoxNote->"Row[{NumberForm[11.825192802056556, {3, 2}], \"%\"}]"],
StyleBox[
TemplateBox[{
TagBox[
InterpretationBox[
                 "\"11.80\"", 11.825192802056556`,
                  AutoDelete -> True], NumberForm[#, {3, 2}]& ],
                "\"%\""}, "RowDefault"], {
GrayLevel[0], FontFamily -> "Arial"}, StripOnInput -> False]],
Annotation[#,
Style[
Row[{
NumberForm[11.825192802056556`, {3, 2}], "%"}], {
GrayLevel[0], FontFamily -> "Arial"}], "Tooltip"]& ],
EventHandlerTag[{
            "MouseClicked" :> FEPrivate`Set[
              DynamicChart`click$240243$240326,
FEPrivate`Not[DynamicChart`click$240243$240326]],
             PassEventsDown -> True, Method -> "Preemptive",
             PassEventsUp -> True}]], Dynamic[
          If[DynamicChart`click$240243$240326, {{{1., 0}, {0, 1.}}, {
             0.08957267836310434, 0.17882039953780404`}}, {{1, 0}, {0,
             1}}, {{1, 0}, {0, 1}}],
           TrackedSymbols :> {DynamicChart`click$240243$240326}]],
         GeometricTransformationBox[
TagBox[
TagBox[
TooltipBox[
TagBox[{{}, {{}, {
{GrayLevel[0], Thickness[0.002], Opacity[1],
StyleBox[{
                    LineBox[{{0.931784095833289,
                    0.36301294570874476`}, {1.024962505416618,
                    0.39931424027961926`}}],
                    LineBox[{{1.024962505416618,
                    0.39931424027961926`}, {1.1249625054166181`,
                    0.39931424027961926`}}]},
FontFamily->"Arial"]},
{GrayLevel[0], Opacity[1],
StyleBox[DiskBox[{0.931784095833289, 0.36301294570874476},
                    0.016666666666666666],
FontFamily->"Arial"]}, InsetBox[
StyleBox["\<\"make\"\>",
StripOnInput->False,
FontFamily->"Arial",
FontColor->GrayLevel[0],
$CellContext`LineColor -> GrayLevel[0],
$CellContext`FrontFaceColor -> GrayLevel[0],
$CellContext`BackFaceColor -> GrayLevel[0],
$CellContext`GraphicsColor -> GrayLevel[0]], {1.1622338692499496, 0.39931424027961926},
                   ImageScaled[{0, Rational[1, 2]}]]}}},
StatusArea[#,
Row[{
NumberForm[11.568123393316196`, {3, 2}], "%"}]]& ,
TagBoxNote->"Row[{NumberForm[11.568123393316196, {3, 2}], \"%\"}]"],
StyleBox[
TemplateBox[{
TagBox[
InterpretationBox[
                 "\"11.60\"", 11.568123393316196`,
                  AutoDelete -> True], NumberForm[#, {3, 2}]& ],
                "\"%\""}, "RowDefault"], {
GrayLevel[0], FontFamily -> "Arial"}, StripOnInput -> False]],
Annotation[#,
Style[
Row[{
NumberForm[11.568123393316196`, {3, 2}], "%"}], {
GrayLevel[0], FontFamily -> "Arial"}], "Tooltip"]& ],
EventHandlerTag[{
            "MouseClicked" :> FEPrivate`Set[
              DynamicChart`click$240248$240326,
FEPrivate`Not[DynamicChart`click$240248$240326]],
             PassEventsDown -> True, Method -> "Preemptive",
             PassEventsUp -> True}]], Dynamic[
          If[DynamicChart`click$240248$240326, {{{1., 0}, {0, 1.}}, {
             0.1863568191666578, 0.07260258914174895}}, {{1, 0}, {0,
            1}}, {{1, 0}, {0, 1}}],
           TrackedSymbols :> {DynamicChart`click$240248$240326}]],
         GeometricTransformationBox[
TagBox[
TagBox[
TooltipBox[
TagBox[{{}, {{}, {
{GrayLevel[0], Thickness[0.002], Opacity[1],
StyleBox[{
                    LineBox[{{
                    0.9532774537923615, -0.30209617026892616`}, {
                    1.0486051991715977`, -0.3323057872958188}}],
                    LineBox[{{
                    1.0486051991715977`, -0.3323057872958188}, {
                    1.1486051991715978`, -0.3323057872958188}}]},
FontFamily->"Arial"]},
{GrayLevel[0], Opacity[1],
StyleBox[DiskBox[{0.9532774537923615, -0.30209617026892616},
                    0.016666666666666666],
FontFamily->"Arial"]}, InsetBox[
StyleBox["\<\"sure\"\>",
StripOnInput->False,
FontFamily->"Arial",
FontColor->GrayLevel[0],
$CellContext`LineColor -> GrayLevel[0],
$CellContext`FrontFaceColor -> GrayLevel[0],
$CellContext`BackFaceColor -> GrayLevel[0],
$CellContext`GraphicsColor -> GrayLevel[0]], {1.1867362973232922, -0.3323057872958188},
                   ImageScaled[{0, Rational[1, 2]}]]}}},
StatusArea[#,
Row[{
NumberForm[10.025706940874036`, {3, 2}], "%"}]]& ,
TagBoxNote->"Row[{NumberForm[10.025706940874036, {3, 2}], \"%\"}]"],
StyleBox[
TemplateBox[{
TagBox[
InterpretationBox[
                 "\"10.00\"", 10.025706940874036`,
                  AutoDelete -> True], NumberForm[#, {3, 2}]& ],
                "\"%\""}, "RowDefault"], {
GrayLevel[0], FontFamily -> "Arial"}, StripOnInput -> False]],
Annotation[#,
Style[
Row[{
NumberForm[10.025706940874036`, {3, 2}], "%"}], {
GrayLevel[0], FontFamily -> "Arial"}], "Tooltip"]& ],
EventHandlerTag[{
            "MouseClicked" :> FEPrivate`Set[
              DynamicChart`click$240253$240326,
FEPrivate`Not[DynamicChart`click$240253$240326]],
             PassEventsDown -> True, Method -> "Preemptive",
             PassEventsUp -> True}]], Dynamic[
          If[DynamicChart`click$240253$240326, {{{1., 0}, {0, 1.}}, {
             0.19065549075847232`, -0.060419234053785235`}}, {{1,
            0}, {0, 1}}, {{1, 0}, {0, 1}}],
           TrackedSymbols :> {DynamicChart`click$240253$240326}]],
         GeometricTransformationBox[
TagBox[
TagBox[
TooltipBox[
TagBox[{{}, {{}, {
{GrayLevel[0], Thickness[0.002], Opacity[1],
StyleBox[{
                    LineBox[{{
                    0.605285059434253, -0.7960087919273711}, {
                    0.6658135653776784, -0.8756096711201082}}],
                    LineBox[{{
                    0.6658135653776784, -0.8756096711201082}, {
                    0.7658135653776784, -0.8756096711201082}}]},
FontFamily->"Arial"]},
{GrayLevel[0], Opacity[1],
StyleBox[DiskBox[{0.605285059434253, -0.7960087919273711},
                    0.016666666666666666],
FontFamily->"Arial"]}, InsetBox[
StyleBox["\<\"mom\"\>",
StripOnInput->False,
FontFamily->"Arial",
FontColor->GrayLevel[0],
$CellContext`LineColor -> GrayLevel[0],
$CellContext`FrontFaceColor -> GrayLevel[0],
$CellContext`BackFaceColor -> GrayLevel[0],
$CellContext`GraphicsColor -> GrayLevel[0]], {0.7900249677550485, -0.8756096711201082},
                   ImageScaled[{0, Rational[1, 2]}]]}}},
StatusArea[#,
Row[{
NumberForm[9.511568123393316, {3, 2}], "%"}]]& ,
TagBoxNote->"Row[{NumberForm[9.511568123393316, {3, 2}], \"%\"}]"],
StyleBox[
TemplateBox[{
TagBox[
InterpretationBox["\"9.51\"", 9.511568123393316, AutoDelete -> True],
                 NumberForm[#, {3, 2}]& ], "\"%\""}, "RowDefault"], {
GrayLevel[0], FontFamily -> "Arial"}, StripOnInput -> False]],
Annotation[#,
Style[
Row[{
NumberForm[9.511568123393316, {3, 2}], "%"}], {
GrayLevel[0], FontFamily -> "Arial"}], "Tooltip"]& ],
EventHandlerTag[{
            "MouseClicked" :> FEPrivate`Set[
              DynamicChart`click$240258$240326,
FEPrivate`Not[DynamicChart`click$240258$240326]],
             PassEventsDown -> True, Method -> "Preemptive",
             PassEventsUp -> True}]], Dynamic[
          If[DynamicChart`click$240258$240326, {{{1., 0}, {0, 1.}}, {
             0.12105701188685061`, -0.15920175838547423`}}, {{1, 0}, {
            0, 1}}, {{1, 0}, {0, 1}}],
           TrackedSymbols :> {DynamicChart`click$240258$240326}]],
         GeometricTransformationBox[
TagBox[
TagBox[
TooltipBox[
TagBox[{{}, {{}, {
{GrayLevel[0], Thickness[0.002], Opacity[1],
StyleBox[{
                    LineBox[{{
                    0.06053352244926136, -0.9981661648542716}, {
                    0.0665868746941875, -1.0979827813396987`}}],
                    LineBox[{{
                    0.0665868746941875, -1.0979827813396987`}, {
                    0.1665868746941875, -1.0979827813396987`}}]},
FontFamily->"Arial"]},
{GrayLevel[0], Opacity[1],
StyleBox[DiskBox[{0.06053352244926136, -0.9981661648542716},
                    0.016666666666666666],
FontFamily->"Arial"]}, InsetBox[
StyleBox["\<\"watch\"\>",
StripOnInput->False,
FontFamily->"Arial",
FontColor->GrayLevel[0],
$CellContext`LineColor -> GrayLevel[0],
$CellContext`FrontFaceColor -> GrayLevel[0],
$CellContext`BackFaceColor -> GrayLevel[0],
$CellContext`GraphicsColor -> GrayLevel[0]], {0.16900821559215795, -1.0979827813396987},
                   ImageScaled[{0, Rational[1, 2]}]]}}},
StatusArea[#,
Row[{
NumberForm[9.254498714652955, {3, 2}], "%"}]]& ,
TagBoxNote->"Row[{NumberForm[9.254498714652955, {3, 2}], \"%\"}]"],
StyleBox[
TemplateBox[{
TagBox[
InterpretationBox["\"9.25\"", 9.254498714652955, AutoDelete -> True],
                 NumberForm[#, {3, 2}]& ], "\"%\""}, "RowDefault"], {
GrayLevel[0], FontFamily -> "Arial"}, StripOnInput -> False]],
Annotation[#,
Style[
Row[{
NumberForm[9.254498714652955, {3, 2}], "%"}], {
GrayLevel[0], FontFamily -> "Arial"}], "Tooltip"]& ],
EventHandlerTag[{
            "MouseClicked" :> FEPrivate`Set[
              DynamicChart`click$240263$240326,
FEPrivate`Not[DynamicChart`click$240263$240326]],
             PassEventsDown -> True, Method -> "Preemptive",
             PassEventsUp -> True}]], Dynamic[
          If[DynamicChart`click$240263$240326, {{{1., 0}, {0, 1.}}, {
             0.012106704489852273`, -0.19963323297085434`}}, {{1,
            0}, {0, 1}}, {{1, 0}, {0, 1}}],
           TrackedSymbols :> {DynamicChart`click$240263$240326}]],
         GeometricTransformationBox[
TagBox[
TagBox[
TooltipBox[
TagBox[{{}, {{}, {
{GrayLevel[0], Thickness[0.002], Opacity[1],
StyleBox[{
                    LineBox[{{-0.48712317500306995`, \
-0.8733332768049826}, {-0.535835492503377, -0.9606666044854809}}],
                    LineBox[{{-0.535835492503377, \
-0.9606666044854809}, {-0.635835492503377, -0.9606666044854809}}]},
FontFamily->"Arial"]},
{GrayLevel[0], Opacity[1],
StyleBox[DiskBox[{-0.48712317500306995, -0.8733332768049826},
                    0.016666666666666666],
FontFamily->"Arial"]}, InsetBox[
StyleBox["\<\"forever\"\>",
StripOnInput->False,
FontFamily->"Arial",
FontColor->GrayLevel[0],
$CellContext`LineColor -> GrayLevel[0],
$CellContext`FrontFaceColor -> GrayLevel[0],
$CellContext`BackFaceColor -> GrayLevel[0],
$CellContext`GraphicsColor -> GrayLevel[0]], {-0.6553204195034997, -0.9606666044854809},
                   ImageScaled[{1, Rational[1, 2]}]]}}},
StatusArea[#,
Row[{
NumberForm[8.868894601542419, {3, 2}], "%"}]]& ,
TagBoxNote->"Row[{NumberForm[8.868894601542419, {3, 2}], \"%\"}]"],
StyleBox[
TemplateBox[{
TagBox[
InterpretationBox["\"8.87\"", 8.868894601542419, AutoDelete -> True],
                 NumberForm[#, {3, 2}]& ], "\"%\""}, "RowDefault"], {
GrayLevel[0], FontFamily -> "Arial"}, StripOnInput -> False]],
Annotation[#,
Style[
Row[{
NumberForm[8.868894601542419, {3, 2}], "%"}], {
GrayLevel[0], FontFamily -> "Arial"}], "Tooltip"]& ],
EventHandlerTag[{
            "MouseClicked" :> FEPrivate`Set[
              DynamicChart`click$240268$240326,
FEPrivate`Not[DynamicChart`click$240268$240326]],
             PassEventsDown -> True, Method -> "Preemptive",
             PassEventsUp -> True}]], Dynamic[
          If[DynamicChart`click$240268$240326, {{{1., 0}, {
              0, 1.}}, {-0.09742463500061399, \
-0.17466665536099654`}}, {{1, 0}, {0, 1}}, {{1, 0}, {0, 1}}],
           TrackedSymbols :> {DynamicChart`click$240268$240326}]],
         GeometricTransformationBox[
TagBox[
TagBox[
TooltipBox[
TagBox[{{}, {{}, {
{GrayLevel[0], Thickness[0.002], Opacity[1],
StyleBox[{
                    LineBox[{{-0.8400606963743522, \
-0.5424924205987015}, {-0.9240667660117875, -0.5967416626585718}}],
                    LineBox[{{-0.9240667660117875, \
-0.5967416626585718}, {-1.0240667660117875`, -0.5967416626585718}}]},
FontFamily->"Arial"]},
{GrayLevel[0], Opacity[1],
StyleBox[DiskBox[{-0.8400606963743522, -0.5424924205987015},
                    0.016666666666666666],
FontFamily->"Arial"]}, InsetBox[
StyleBox["\<\"ask\"\>",
StripOnInput->False,
FontFamily->"Arial",
FontColor->GrayLevel[0],
$CellContext`LineColor -> GrayLevel[0],
$CellContext`FrontFaceColor -> GrayLevel[0],
$CellContext`BackFaceColor -> GrayLevel[0],
$CellContext`GraphicsColor -> GrayLevel[0]], {-1.0576691938667617, -0.5967416626585718},
                   ImageScaled[{1, Rational[1, 2]}]]}}},
StatusArea[#,
Row[{
NumberForm[6.683804627249357, {3, 2}], "%"}]]& ,
TagBoxNote->"Row[{NumberForm[6.683804627249357, {3, 2}], \"%\"}]"],
StyleBox[
TemplateBox[{
TagBox[
InterpretationBox["\"6.68\"", 6.683804627249357, AutoDelete -> True],
                 NumberForm[#, {3, 2}]& ], "\"%\""}, "RowDefault"], {
GrayLevel[0], FontFamily -> "Arial"}, StripOnInput -> False]],
Annotation[#,
Style[
Row[{
NumberForm[6.683804627249357, {3, 2}], "%"}], {
GrayLevel[0], FontFamily -> "Arial"}], "Tooltip"]& ],
EventHandlerTag[{
            "MouseClicked" :> FEPrivate`Set[
              DynamicChart`click$240273$240326,
FEPrivate`Not[DynamicChart`click$240273$240326]],
             PassEventsDown -> True, Method -> "Preemptive",
             PassEventsUp -> True}]], Dynamic[
          If[DynamicChart`click$240273$240326, {{{1., 0}, {
              0, 1.}}, {-0.16801213927487046`, \
-0.10849848411974031`}}, {{1, 0}, {0, 1}}, {{1, 0}, {0, 1}}],
           TrackedSymbols :> {DynamicChart`click$240273$240326}]],
         GeometricTransformationBox[
TagBox[
TagBox[
TooltipBox[
TagBox[{{}, {{}, {
{GrayLevel[0], Thickness[0.002], Opacity[1],
StyleBox[{
                    LineBox[{{-0.9835358144361508, \
-0.18071331362524856`}, {-1.081889395879766, -0.19878464498777343`}}],
                     LineBox[{{-1.081889395879766, \
-0.19878464498777343`}, {-1.181889395879766, -0.19878464498777343`}}]},
FontFamily->"Arial"]},
{GrayLevel[0], Opacity[1],
StyleBox[DiskBox[{-0.9835358144361508, -0.18071331362524856},
                    0.016666666666666666],
FontFamily->"Arial"]}, InsetBox[
StyleBox["\<\"just\"\>",
StripOnInput->False,
FontFamily->"Arial",
FontColor->GrayLevel[0],
$CellContext`LineColor -> GrayLevel[0],
$CellContext`FrontFaceColor -> GrayLevel[0],
$CellContext`BackFaceColor -> GrayLevel[0],
$CellContext`GraphicsColor -> GrayLevel[0]], {-1.2212308284572122, -0.19878464498777343},
                   ImageScaled[{1, Rational[1, 2]}]]}}},
StatusArea[#,
Row[{
NumberForm[5.784061696658098, {3, 2}], "%"}]]& ,
TagBoxNote->"Row[{NumberForm[5.784061696658098, {3, 2}], \"%\"}]"],
StyleBox[
TemplateBox[{
TagBox[
InterpretationBox["\"5.78\"", 5.784061696658098, AutoDelete -> True],
                 NumberForm[#, {3, 2}]& ], "\"%\""}, "RowDefault"], {
GrayLevel[0], FontFamily -> "Arial"}, StripOnInput -> False]],
Annotation[#,
Style[
Row[{
NumberForm[5.784061696658098, {3, 2}], "%"}], {
GrayLevel[0], FontFamily -> "Arial"}], "Tooltip"]& ],
EventHandlerTag[{
            "MouseClicked" :> FEPrivate`Set[
              DynamicChart`click$240278$240326,
FEPrivate`Not[DynamicChart`click$240278$240326]],
             PassEventsDown -> True, Method -> "Preemptive",
             PassEventsUp -> True}]], Dynamic[
          If[DynamicChart`click$240278$240326, {{{1., 0}, {
              0, 1.}}, {-0.19670716288723017`, \
-0.036142662725049714`}}, {{1, 0}, {0, 1}}, {{1, 0}, {0, 1}}],
           TrackedSymbols :> {
            DynamicChart`click$240278$240326}]]}, {}}, {}}},
DynamicModuleValues:>{}], {{}, {}}, {{{}, {}, {}, {}}, {}}},
ContentSelectable->False,
GridLinesStyle->Directive[
GrayLevel[0.5, 0.4]],
ImageSize->{483., Automatic},
LabelStyle->{
GrayLevel[0], FontFamily -> "Arial"},
PlotRange->{{-1.2, 1.2}, {-1.2, 1.2}},
PlotRangePadding->Scaled[0.1]]\)