シカゴとヨーロッパ諸国の首都の天候を比べる
ヨーロッパ連合の加盟国の首都の中で,昨年1年間に渡ってシカゴの気温と最もよく似た気温を記録した都市を求める.WarpingDistanceを使って,気温の配列間の類似度を見極める.
In[1]:=
chicagoTemp =
  WeatherData["Chicago",
   "Temperature", {{2015, 7}, {2016, 6}, "Week"}, "Value"];
ヨーロッパ連合加盟国のすべての首都について気温を得る.
In[2]:=
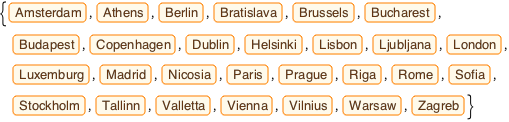
capitals = CityData /@ CountryData["EU", "CapitalCity"] // SortOut[2]=
In[3]:=
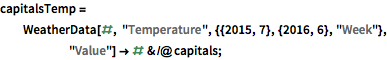
capitalsTemp =
  WeatherData[#, "Temperature", {{2015, 7}, {2016, 6}, "Week"},
      "Value"] -> # & /@ capitals;
シカゴの気温に最も似た気温を記録した首都を求める.
In[4]:=
Nearest[capitalsTemp, chicagoTemp,
 DistanceFunction -> (QuantityMagnitude@WarpingDistance[##] &)]
Out[4]=
2点間の距離行列を計算する.
In[5]:=
dm = DistanceMatrix[Keys@capitalsTemp,
DistanceFunction -> (QuantityMagnitude@WarpingDistance[##] &)];距離行列の7×7の部分行列を表示する.
In[6]:=
MatrixForm[Take[dm, 7, 7]]Out[6]//MatrixForm=

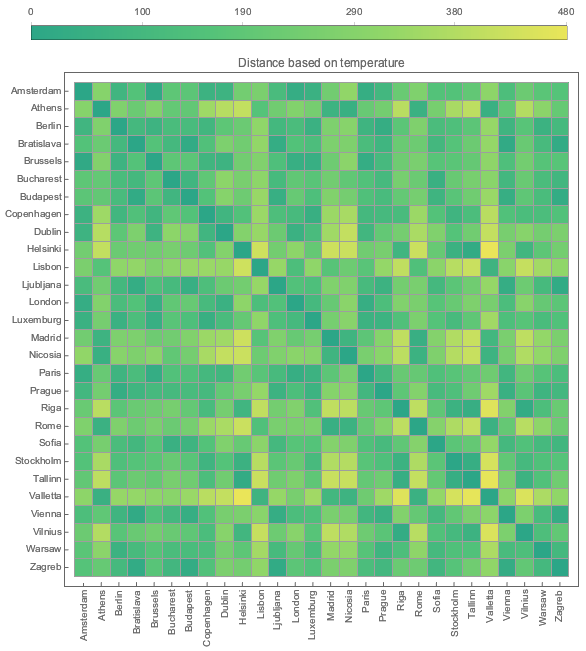
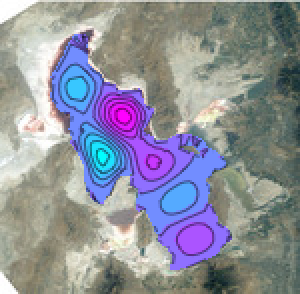
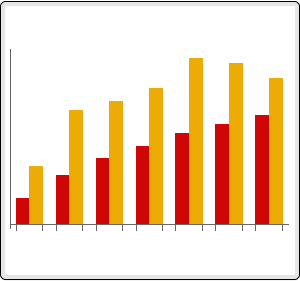
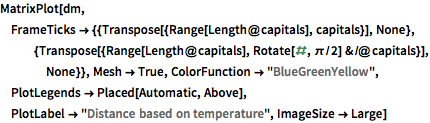
先ほど計算した距離行列を使って,気温の類似度を可視化する.
完全なWolfram言語入力を表示する
Out[7]=