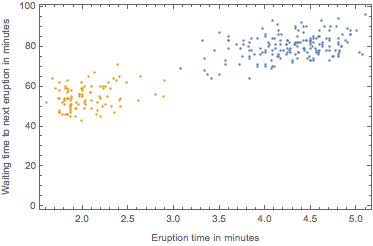
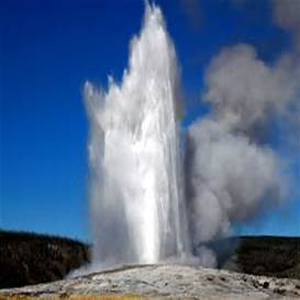
Cluster von Geysireruptionen
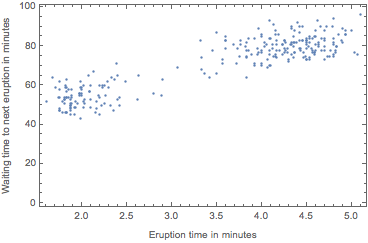
Visualisieren Sie Eigenschaften von Eruptionen des Old Faithful-Geysirs.
In[1]:=
eruptions = ExampleData[{"Statistics", "OldFaithful"}];
ListPlot[data,
 FrameLabel -> {"Eruption time in minutes",
   "Waiting time to next eruption in minutes"}, Frame -> True]
Out[1]=
Berechnen Sie einen Klassifikator, der die Eruptionen partitioniert.
In[2]:=
c = ClusterClassify[eruptions]Out[2]=
Visualisieren Sie die Cluster.
In[3]:=
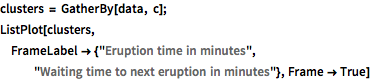
clusters = GatherBy[data, c];
ListPlot[clusters,
 FrameLabel -> {"Eruption time in minutes",
   "Waiting time to next eruption in minutes"}, Frame -> True]
Out[3]=