ガウス過程モデルの予測を可視化する
ガウス過程の予測子を単純なデータ集合について訓練する.
In[1]:=
data = {-1.2 -> 1.2, 1.4 -> 1.4, 3.1 -> 1.8, 4.5 -> 1.6};
p = Predict[data, Method -> "GaussianProcess"]
Out[1]=
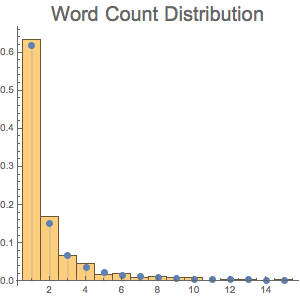
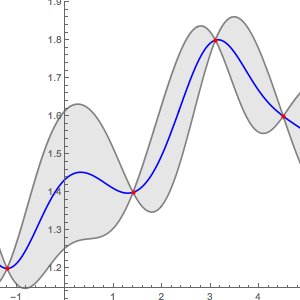
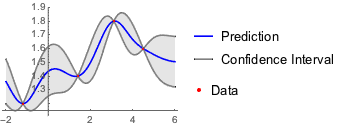
予測された値を信頼区間とともに可視化する.
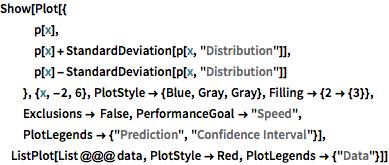
完全なWolfram言語入力を表示する
Out[2]=
ガウス過程の予測子を単純なデータ集合について訓練する.
data = {-1.2 -> 1.2, 1.4 -> 1.4, 3.1 -> 1.8, 4.5 -> 1.6};
p = Predict[data, Method -> "GaussianProcess"]予測された値を信頼区間とともに可視化する.