音频可视化
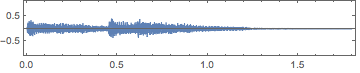
可视化音频信号的波形.
In[1]:=
rule30 = Import["ExampleData/rule30.wav"]Out[1]=
In[2]:=
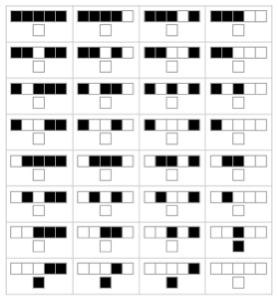
AudioPlot[rule30, ImageSize -> Medium]Out[2]=
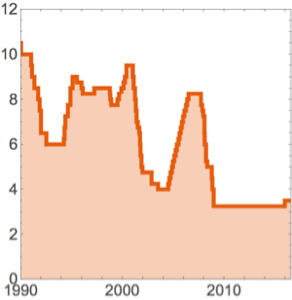
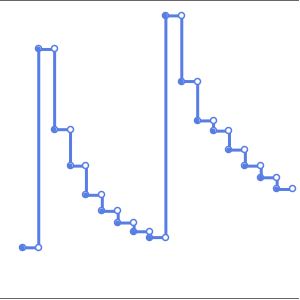
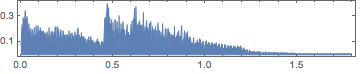
绘制波形的绝对值.
In[3]:=
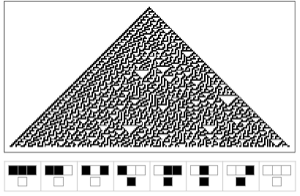
AudioPlot[rule30, Appearance -> "ContinuousAbs", ImageSize -> Medium,
 PlotRange -> All]
Out[3]=
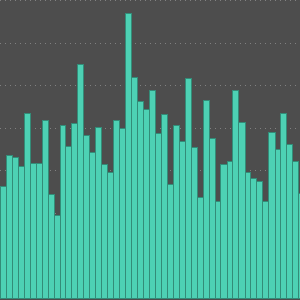
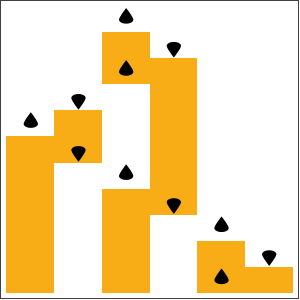
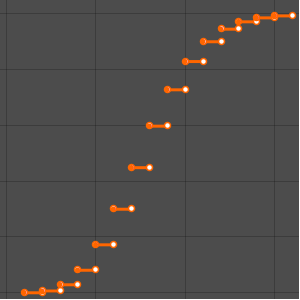
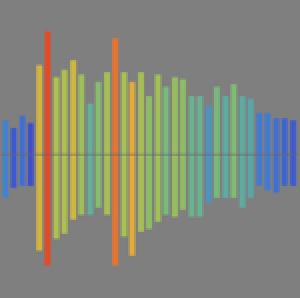
按离散值绘制波形,根据高度着色.
In[4]:=
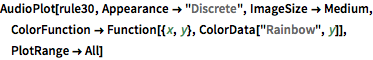
AudioPlot[rule30, Appearance -> "Discrete", ImageSize -> Medium,
 ColorFunction -> Function[{x, y}, ColorData["Rainbow", y]],
 PlotRange -> All]
Out[4]=
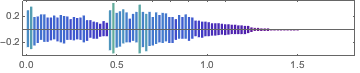
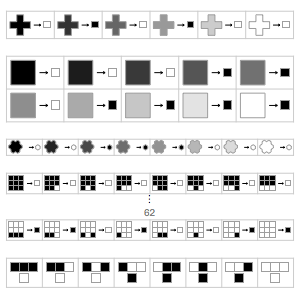
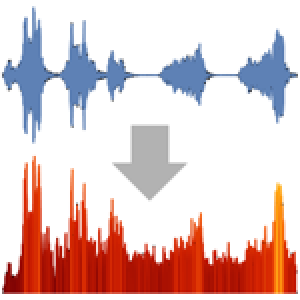
绘制音频信号的频谱图和周期图.
In[5]:=
Spectrogram[rule30, ImageSize -> Medium]Out[5]=
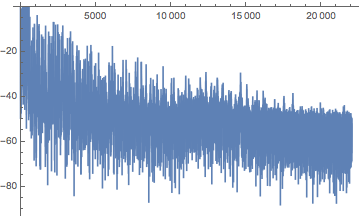
In[6]:=
Periodogram[rule30, ImageSize -> Medium]Out[6]=