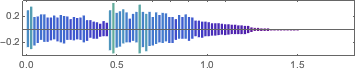
Audio Visualization
Visualize the waveform of an audio signal.
In[1]:=
rule30 = Import["ExampleData/rule30.wav"]Out[1]=
In[2]:=
AudioPlot[rule30, ImageSize -> Medium]Out[2]=
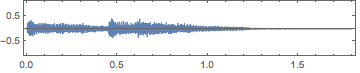
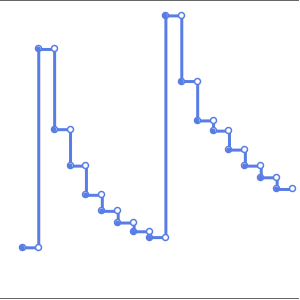
Plot the absolute values of the waveform.
In[3]:=
AudioPlot[rule30, Appearance -> "ContinuousAbs", ImageSize -> Medium,
 PlotRange -> All]
Out[3]=
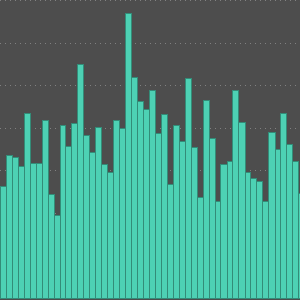
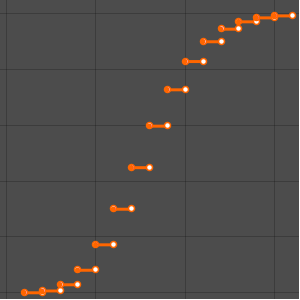
Plot the waveform as discrete values, colored according to height.
In[4]:=
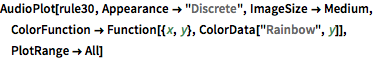
AudioPlot[rule30, Appearance -> "Discrete", ImageSize -> Medium,
 ColorFunction -> Function[{x, y}, ColorData["Rainbow", y]],
 PlotRange -> All]
Out[4]=
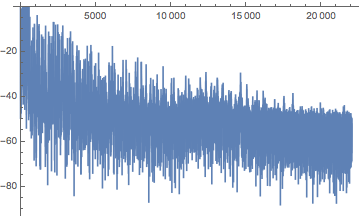
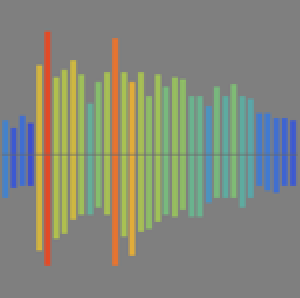
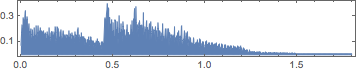
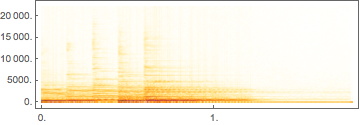
Plot the spectrogram and periodogram of an audio signal.
In[5]:=
Spectrogram[rule30, ImageSize -> Medium]Out[5]=
In[6]:=
Periodogram[rule30, ImageSize -> Medium]Out[6]=