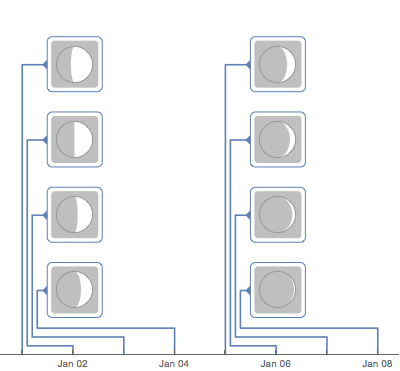
Visualize eventos no tempo com TimelinePlot
De forma padrão, as linhas de tempo irão se alinhar com grupos de legendas.
In[1]:=
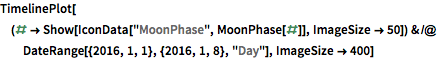
TimelinePlot[(# ->
     Show[IconData["MoonPhase", MoonPhase[#]], ImageSize -> 50]) & /@
  DateRange[{2016, 1, 1}, {2016, 1, 8}, "Day"], ImageSize -> 400]
Out[1]=
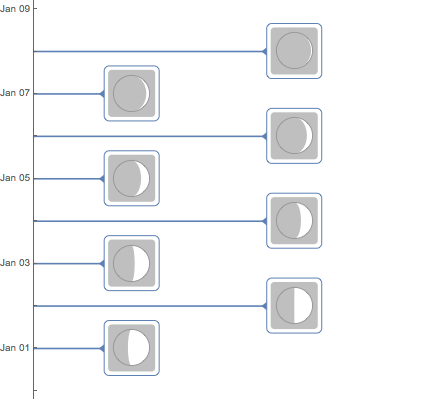
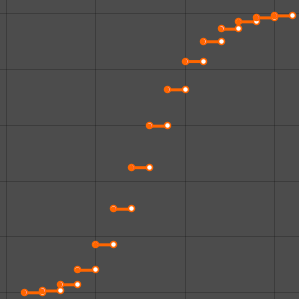
Distribua as legendas horizontalmente.
In[2]:=
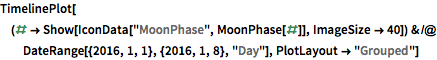
TimelinePlot[(# ->
     Show[IconData["MoonPhase", MoonPhase[#]], ImageSize -> 40]) & /@
  DateRange[{2016, 1, 1}, {2016, 1, 8}, "Day"],
 PlotLayout -> "Grouped"]
Out[2]=
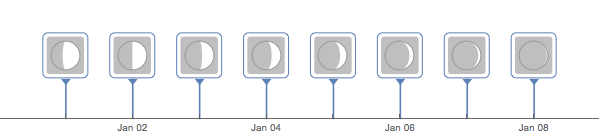
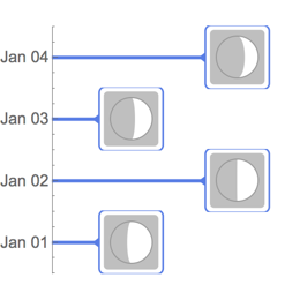
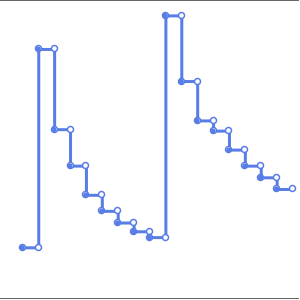
A colocação das legendas se ajustarão automaticamente ao layout da linha do tempo.
In[3]:=
TimelinePlot[(# ->
     Show[IconData["MoonPhase", MoonPhase[#]], ImageSize -> 50]) & /@
  DateRange[{2016, 1, 1}, {2016, 1, 8}, "Day"],
 PlotLayout -> "ReverseVertical", ImageSize -> 400, AspectRatio -> 1]
Out[3]=