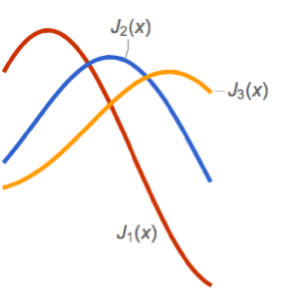
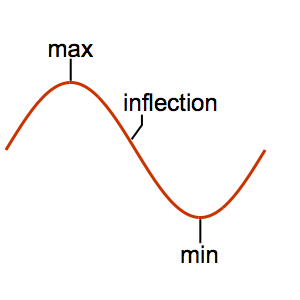
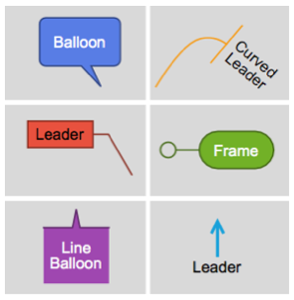
将标签放置在相对于数据曲线的位置
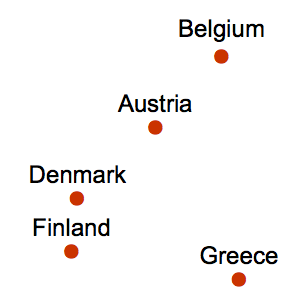
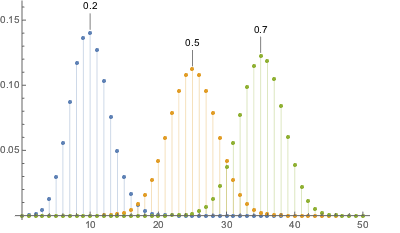
Callout 和 Labeled 可以将标签放置在相对于数据曲线的已命名位置.
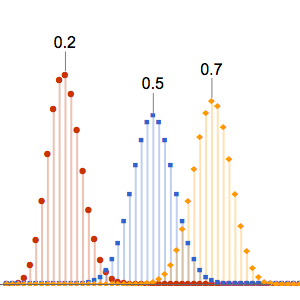
显示完整的 Wolfram 语言输入
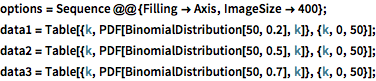
In[2]:=
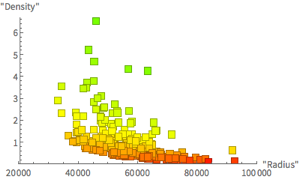
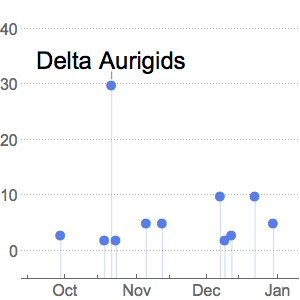
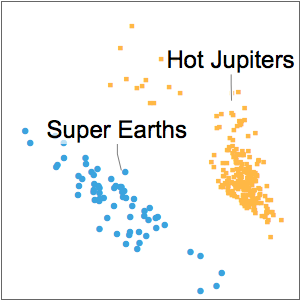
ListPlot[{Callout[data1, "0.2", Above], Callout[data2, "0.5", Above],
  Callout[data3, "0.7", Above]}, options]
Out[2]=
In[3]:=
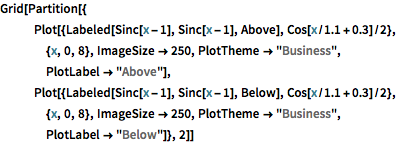
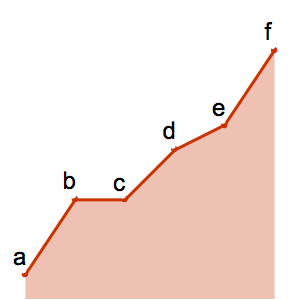
Grid[Partition[{
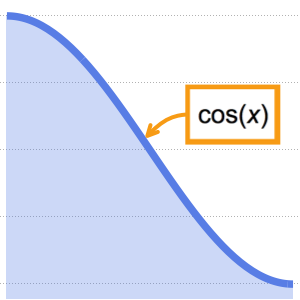
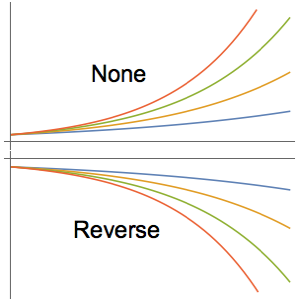
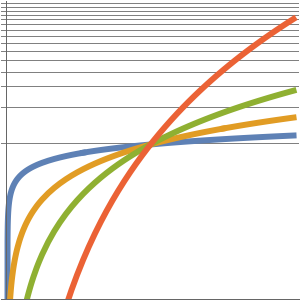
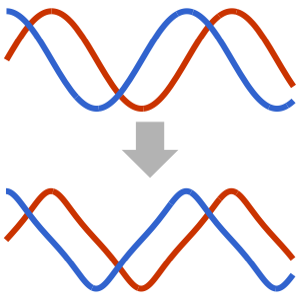
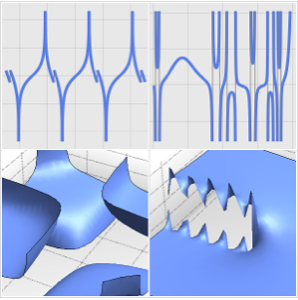
Plot[{Labeled[Sinc[x - 1], Sinc[x - 1], Above],
Cos[x/1.1 + 0.3]/2}, {x, 0, 8}, ImageSize -> 250,
PlotTheme -> "Business", PlotLabel -> "Above"],
Plot[{Labeled[Sinc[x - 1], Sinc[x - 1], Below],
Cos[x/1.1 + 0.3]/2}, {x, 0, 8}, ImageSize -> 250,
PlotTheme -> "Business", PlotLabel -> "Below"]}, 2]]Out[3]=
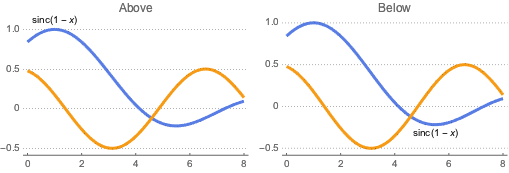
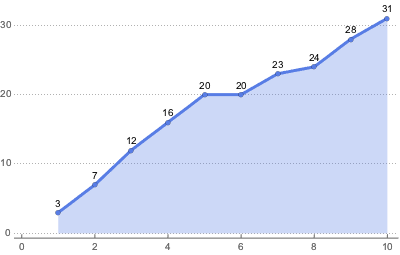
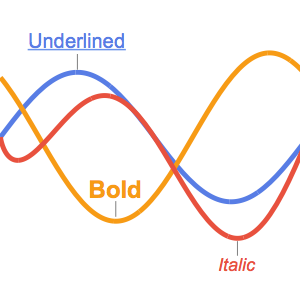
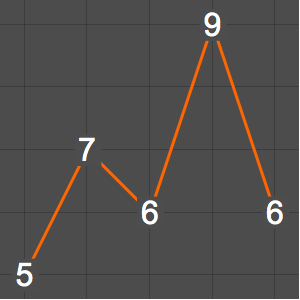
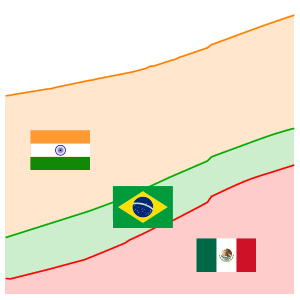
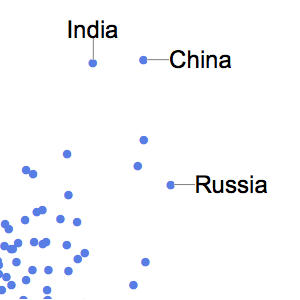
位置可以用于 LabelingFunction 以便自动放置标签.
In[4]:=
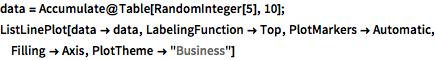
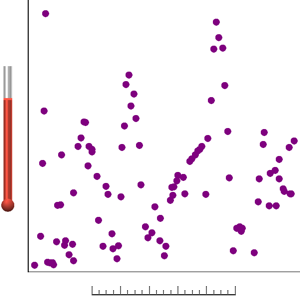
data = Accumulate@Table[RandomInteger[5], 10];
ListLinePlot[data -> data, LabelingFunction -> Top,
 PlotMarkers -> Automatic, Filling -> Axis, PlotTheme -> "Business"]
Out[4]=