データと相対的にラベルを置く
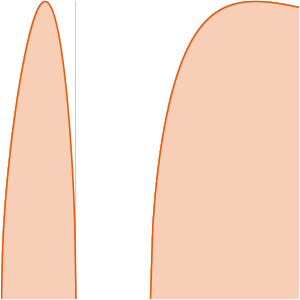
CalloutとLabeledは,データと相対的な名前付きの場所に置くことができる.
完全なWolfram言語入力を表示する
In[2]:=
ListPlot[{Callout[data1, "0.2", Above], Callout[data2, "0.5", Above],
  Callout[data3, "0.7", Above]}, options]
Out[2]=

In[3]:=

Grid[Partition[{
   Plot[{Labeled[Sinc[x - 1], Sinc[x - 1], Above],
     Cos[x/1.1 + 0.3]/2}, {x, 0, 8}, ImageSize -> 250,
    PlotTheme -> "Business", PlotLabel -> "Above"],
   Plot[{Labeled[Sinc[x - 1], Sinc[x - 1], Below],
     Cos[x/1.1 + 0.3]/2}, {x, 0, 8}, ImageSize -> 250,
    PlotTheme -> "Business", PlotLabel -> "Below"]}, 2]]
Out[3]=

場所をLabelingFunctionとして使って自動的にラベルを置く.
In[4]:=

data = Accumulate@Table[RandomInteger[5], 10];
ListLinePlot[data -> data, LabelingFunction -> Top,
 PlotMarkers -> Automatic, Filling -> Axis, PlotTheme -> "Business"]
Out[4]=


