Plot over Regions
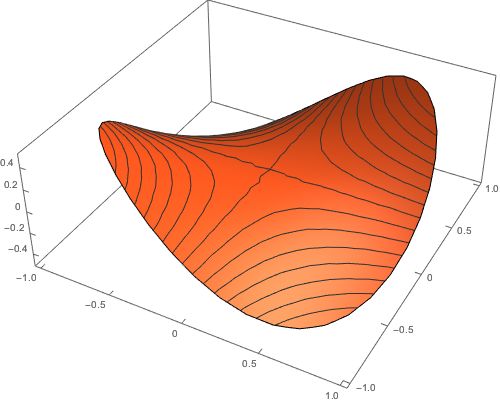
Plot a function over the unit disk.
In[1]:=
Plot3D[x y, {x, y} \[Element] Disk[{0, 0}, 1], ImageSize -> 500,
 PlotTheme -> "Web"]
Out[1]=
Construct a non-convex, disconnected region.
In[2]:=

region = RegionUnion[
   RegionDifference[
    RegionUnion[Disk[{0, 3}, 3], Disk[{3, 0}, 3], Disk[{0, -3}, 3],
     Disk[{-3, 0}, 3]], Disk[{0, 0}, 3]], Disk[{0, 0}, 2]];
In[3]:=
RegionPlot[region]Out[3]=
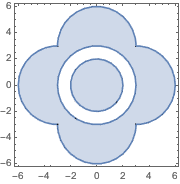
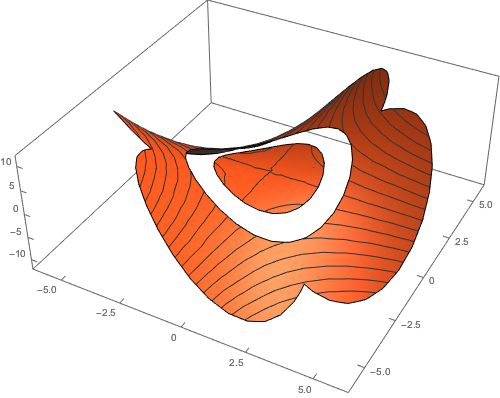
Plot over the region.
In[4]:=
Plot3D[x y, {x, y} \[Element] region, ImageSize -> 500,
 PlotTheme -> "Web"]
Out[4]=
