Generate Color‐Magnitude Diagrams of Stars
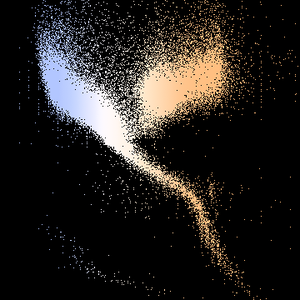
Color‐magnitude diagrams are useful for determining the type of star being considered. If you know the B‐V color index (difference in brightness between a star taken in blue and green filters) and the absolute magnitude (how bright the star appears from 10 parsecs), you find that stars are not randomly scattered in the plot space. They tend to cluster into specific areas in the resulting diagram, sometimes known as a Hertzsprung–Russell diagram.
For example, the Sun's B-V color index and absolute magnitude can be obtained with the following.
You can similarly obtain the values for all available stars with the following.
A function to approximate the effective temperature in kelvins from the B-V color index is needed, so you can make use of Ballesteros's formula.
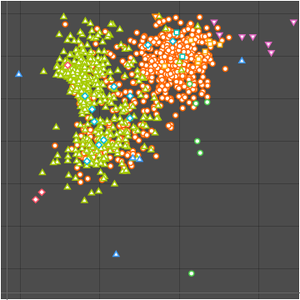
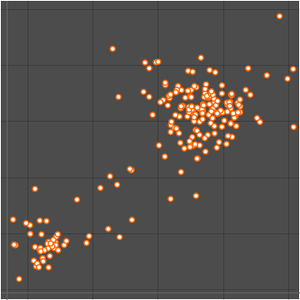
Now you can plot the data, including a color function to color based on temperature.
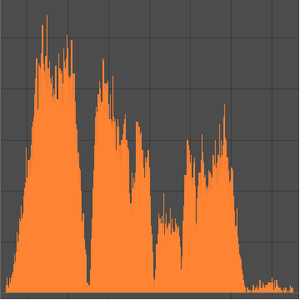
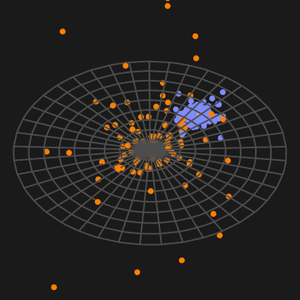
The available star data is more populated in some areas than others.