Analyze a Color-Based Diet
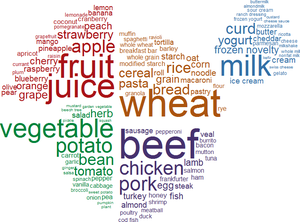
In the world of food and cooking, there are a wide variety of colors. With curated inside and outside colors of hundreds of food types, the Wolfram Language provides an easy way to easily color charts and other visualizations with colors relevant to the foods they represent.
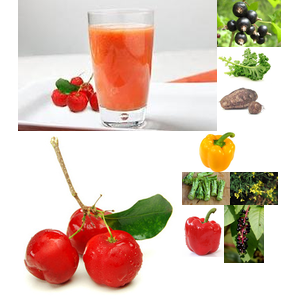
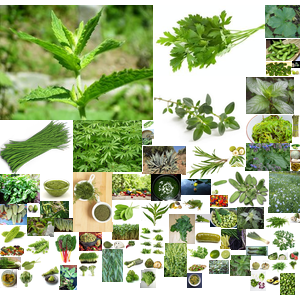
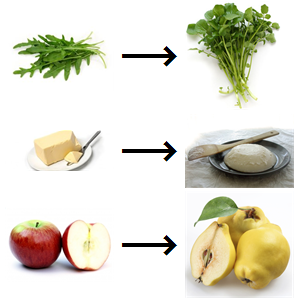
Find the most common outside color for each food type.
Group the food types by color.
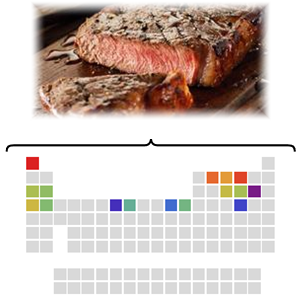
Find RGB colors for each food color.
Create a Dataset expression to see the values in a table.
Gather the caloric distribution of the foods for each outside color.
Visualize the calorie distributions using the colors associated with each one.
Visualize the average nutrition of the food colors sized by count in 3D nutrition space.
show complete Wolfram Language input