Observe Helium Transitions within the Visible Spectrum
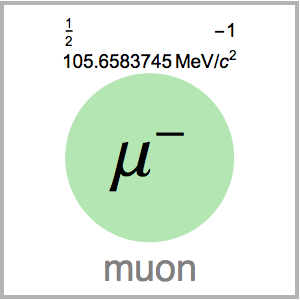
Due to quantum mechanics, electrons are constrained to certain energy levels within an atom. The Wolfram Language provides access to energy level data from the NIST Atomic Spectra Database for the entire table of elements.
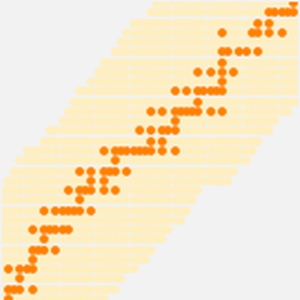
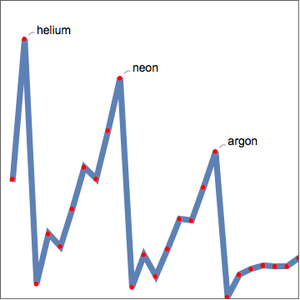
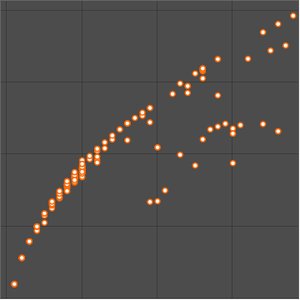
Examine the energies of different atomic states.
Visualize the jumps between atomic energy levels for neutral helium that result in line transitions within the visible spectrum and visualize the jumps in atomic levels.
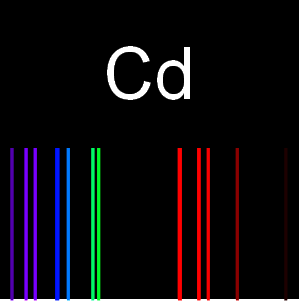
Obtain the lines within the visible spectrum for neutral helium.
Get the upper and lower energy level for each transition as well as the resulting wavelength.
Plot wavelengths within the visible spectrum for carbon.
Extract the upper and lower levels for each transition.
Gather energy information for each atomic level.
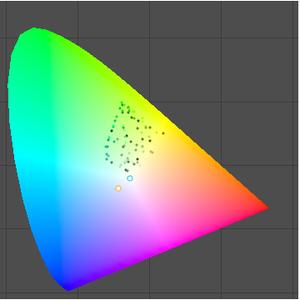
Determine the colors for each transition.
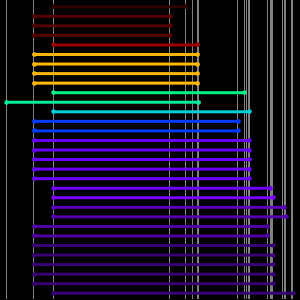
Plot each transition in terms of the energy levels of the initial and final atomic levels.
Next add in some grid lines corresponding to the energy levels within this range.
Obtain the energies and select the energy levels within the range of the plot.
Plot the transitions relative to all energy levels.
Examine the atomic levels lacking transitions.
Compare this to the number of energy levels involved in transitions within the visible spectrum.