‹›Image and Signal ProcessingCompare Stock Prices Using DTW
Use WarpingCorrespondence to compare the first quarter of 2016 of the HPQ stock prices with historical data from 2010 to 2015.
recent = FinancialData["HPQ", {{2016, 1, 1}, {2016, 3, 31}},
   "Value"];
{histDates, hist} =
  Transpose[
   FinancialData["HPQ", {{2010, 1, 1}, {2015, 1, 31}}, "DateValue"]];
Find the best matching subsequence of historical data.
{corrHist, corrRecent} =
  WarpingCorrespondence[hist, recent,
   Method -> {"MatchingInterval" -> "Flexible"}];
Detect the historical interval most similar to quarter one of 2016.
{m, n} = corrHist[[{1, -1}]];
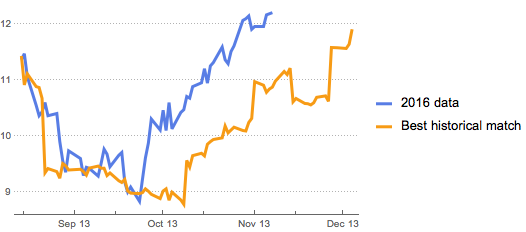
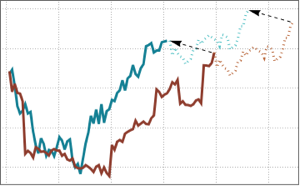
histDates[[{m, n}]]Visually compare recent data and the best historical match.
show complete Wolfram Language input
DateListPlot[{AssociationThread[
   Take[histDates[[m ;; n]], Length[recent]], recent],
  AssociationThread[histDates[[m ;; n]], hist[[m ;; n]]]},
 PlotTheme -> "Business",
 PlotLegends -> {"2016 data", "Best historical match"},
 DateTicksFormat -> {"MonthNameShort", " ", "YearShort"},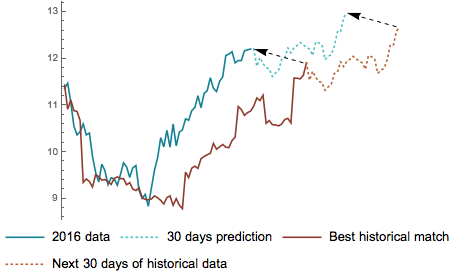
ImageSize -> Medium]Predict the stock prices for the next 30 days based on historical data.
show complete Wolfram Language input
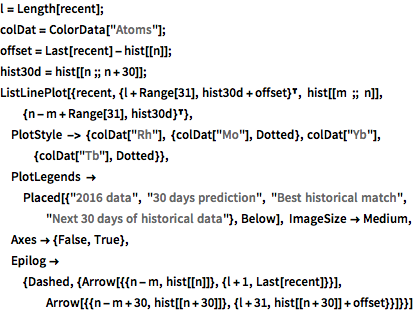
l = Length[recent];
colDat = ColorData["Atoms"];
offset = Last[recent] - hist[[n]];
hist30d = hist[[n ;; n + 30]];
ListLinePlot[{recent, {l + Range[31], hist30d + offset}\[Transpose],
  hist[[m ;; n]], {n - m + Range[31], hist30d}\[Transpose]},
 PlotStyle -> {colDat["Rh"], {colDat["Mo"], Dotted},
   colDat["Yb"], {colDat["Tb"], Dotted}},
 PlotLegends ->
  Placed[{"2016 data", "30 days prediction", "Best historical match",
    "Next 30 days of historical data"}, Below], ImageSize -> Medium,
 Axes -> {False, True},
 Epilog -> {Dashed, {Arrow[{{n - m, hist[[n]]}, {l + 1,
       Last[recent]}}],
    Arrow[{{n - m + 30, hist[[n + 30]]}, {l + 31,
       hist[[n + 30]] + offset}}]}}]