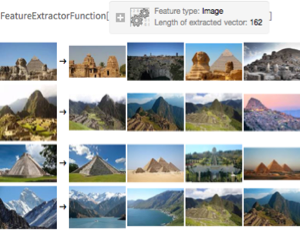
‹›이미지 처리 및 신호 처리동적 시간 신축법을 사용한 주식 비교
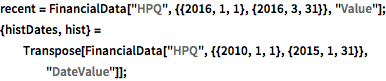
WarpingCorrespondence를 사용하여 HPQ의 2016년 1분기 주가와 2010년부터 2015년까지의 과거 데이터를 비교합니다.
recent = FinancialData["HPQ", {{2016, 1, 1}, {2016, 3, 31}},
   "Value"];
{histDates, hist} =
  Transpose[
   FinancialData["HPQ", {{2010, 1, 1}, {2015, 1, 31}}, "DateValue"]];
과거의 데이터 중 가장 잘 매칭하는 부분 배열을 구합니다.
{corrHist, corrRecent} =
  WarpingCorrespondence[hist, recent,
   Method -> {"MatchingInterval" -> "Flexible"}];
2016년 1분기의 데이터와 가장 유사한 과거 데이터를 검출합니다.
{m, n} = corrHist[[{1, -1}]];
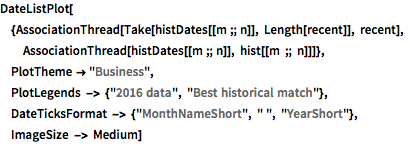
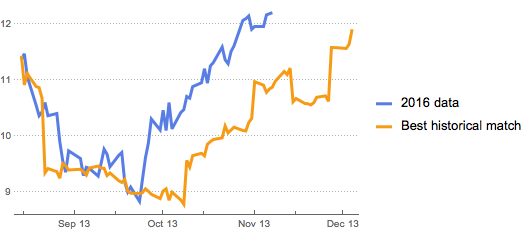
histDates[[{m, n}]]최근 데이터와 과거 데이터 중 가장 잘 일치하는 데이터와 시각적으로 비교합니다.
전체 Wolfram 언어 입력 표시하기
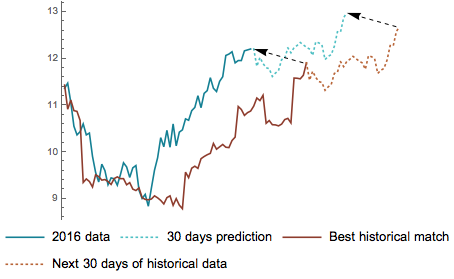
DateListPlot[{AssociationThread[
   Take[histDates[[m ;; n]], Length[recent]], recent],
  AssociationThread[histDates[[m ;; n]], hist[[m ;; n]]]},
 PlotTheme -> "Business",
 PlotLegends -> {"2016 data", "Best historical match"},
 DateTicksFormat -> {"MonthNameShort", " ", "YearShort"},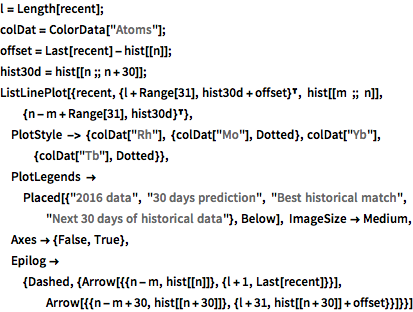
ImageSize -> Medium]과거 데이터를 기반으로 향후 30일 동안의 주가를 예측합니다.
전체 Wolfram 언어 입력 표시하기
l = Length[recent];
colDat = ColorData["Atoms"];
offset = Last[recent] - hist[[n]];
hist30d = hist[[n ;; n + 30]];
ListLinePlot[{recent, {l + Range[31], hist30d + offset}\[Transpose],
  hist[[m ;; n]], {n - m + Range[31], hist30d}\[Transpose]},
 PlotStyle -> {colDat["Rh"], {colDat["Mo"], Dotted},
   colDat["Yb"], {colDat["Tb"], Dotted}},
 PlotLegends ->
  Placed[{"2016 data", "30 days prediction", "Best historical match",
    "Next 30 days of historical data"}, Below], ImageSize -> Medium,
 Axes -> {False, True},
 Epilog -> {Dashed, {Arrow[{{n - m, hist[[n]]}, {l + 1,
       Last[recent]}}],
    Arrow[{{n - m + 30, hist[[n + 30]]}, {l + 31,
       hist[[n + 30]] + offset}}]}}]