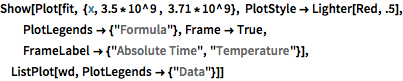
지난 10년 동안의 로마의 기온을 로드합니다.
wd = WeatherData["Rome",
  "Temperature", {{2006, 1, 1}, {2016, 1, 1}, "Month"}]
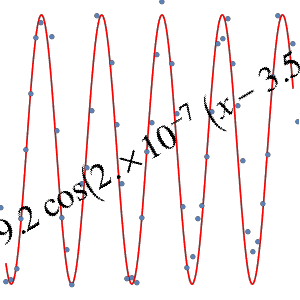
이 시계열에 대한 간단한 식을 구합니다.
fit = FindFormula[wd, x]
수식과 데이터를 비교합니다.
Show[Plot[fit, {x, 3.5*10^9 , 3.71*10^9},
  PlotStyle -> Lighter[Red, .5], PlotLegends -> {"Formula"},
  Frame -> True, FrameLabel -> {"Absolute Time", "Temperature"}],
 ListPlot[wd, PlotLegends -> {"Data"}]]