‹›Improved Machine LearningVisualize the Predictions of a Gaussian Process Model
Train a Gaussian process predictor on a simple dataset.
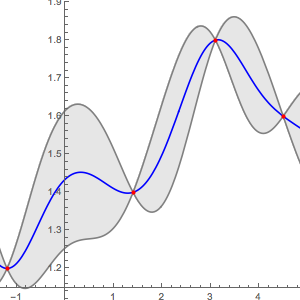
data = {-1.2 -> 1.2, 1.4 -> 1.4, 3.1 -> 1.8, 4.5 -> 1.6};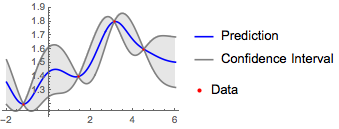
p = Predict[data, Method -> "GaussianProcess"]Visualize the predicted values along with a confidence interval.
show complete Wolfram Language input
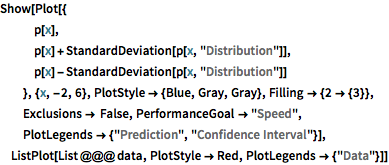
Show[Plot[{
   p[x],
   p[x] + StandardDeviation[p[x, "Distribution"]],
   p[x] - StandardDeviation[p[x, "Distribution"]]
   }, {x, -2, 6}, PlotStyle -> {Blue, Gray, Gray},
  Filling -> {2 -> {3}}, Exclusions -> False,
  PerformanceGoal -> "Speed",
  PlotLegends -> {"Prediction", "Confidence Interval"}],
 ListPlot[List @@@ data, PlotStyle -> Red, PlotLegends -> {"Data"}]]