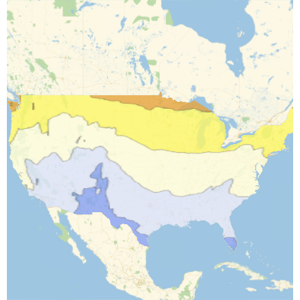
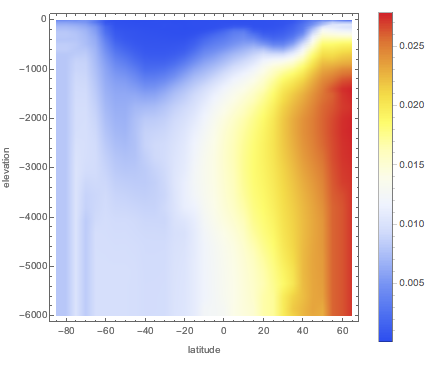
地球の海洋の詳しいモデルを調べる
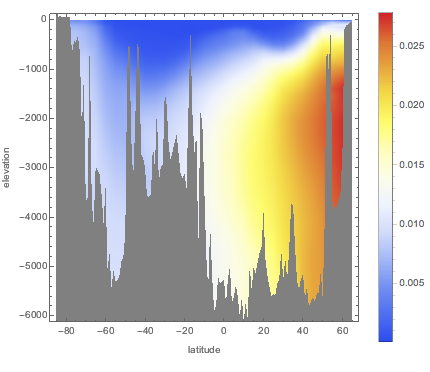
海水の塩度が深度によって標準平均値の35.2g/kgからどのように変化するかを調べる.
0メートルから6000メートルの深さについて,温度が一定で15°Cであると想定して,東経180°における塩分偏差の値の配列を計算する.
In[1]:=
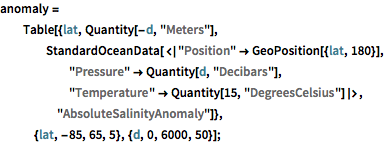
anomaly =
Table[{lat, Quantity[-d, "Meters"],
StandardOceanData[<|"Position" -> GeoPosition[{lat, 180}],
"Pressure" -> Quantity[d, "Decibars"],
"Temperature" -> Quantity[15, "DegreesCelsius"]|>,
"AbsoluteSalinityAnomaly"]},
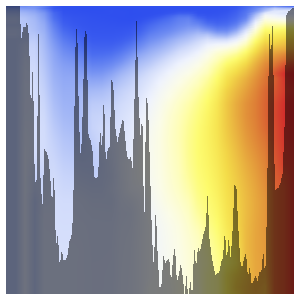
{lat, -85, 65, 5}, {d, 0, 6000, 50}];経度が高い地域で最大の偏差が見られる.
In[2]:=
anomalyPlot =
 ListDensityPlot[Flatten[anomaly, 1],
  ColorFunction -> "TemperatureMap",
  FrameLabel -> {"latitude", "elevation"}, PlotLegends -> Automatic,
  ImageSize -> Medium]
Out[2]=
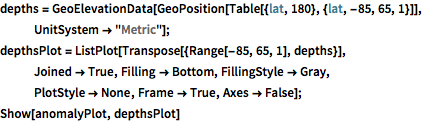
同じ経度の海底における高度の統計データを重ね合せる.
完全なWolfram言語入力を表示する
Out[3]=