Audio Time Series Properties
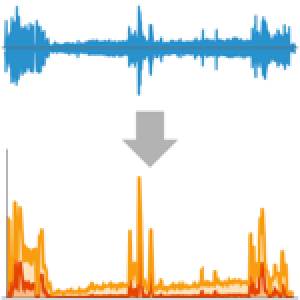
ExampleData contains the famous recording of the Apollo 13 crew reporting the oxygen tank explosion to mission control in Houston on April 13, 1970.
In[1]:=
audio = ExampleData[{"Sound", "Apollo13Problem"}, "Audio"]Out[1]=
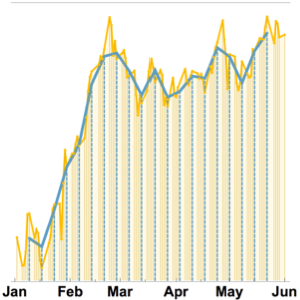
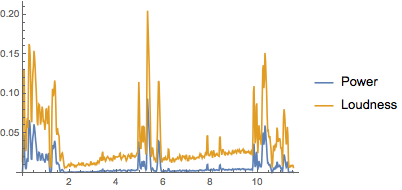
The power and loudness indicate when something was spoken.
In[2]:=
{power, loudness} =
 AudioLocalMeasurements[audio, {"Power", "Loudness"}, "List"]
Out[2]=
In[3]:=
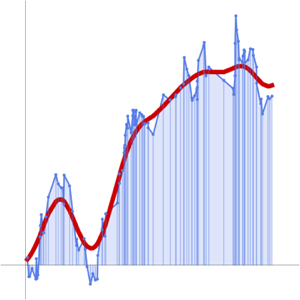
ListLinePlot[{power, loudness}, PlotRange -> All,
 PlotLegends -> {"Power", "Loudness"}]
Out[3]=
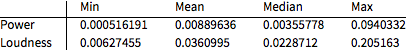
Compute some summary statistics for the power and loudness time series.
In[4]:=
summary[ts_] := {Min[ts], Mean[ts], Median[ts], Max[ts]};In[5]:=
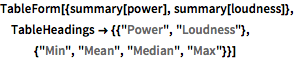
TableForm[{summary[power], summary[loudness]},
 TableHeadings -> {{"Power", "Loudness"}, {"Min", "Mean", "Median",
    "Max"}}]
Out[5]//TableForm=