Data from Internet Sources
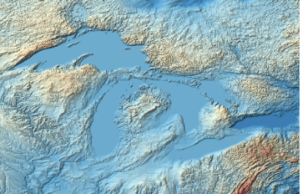
Download daily mean temperatures for the past year for the Great Lakes.
In[1]:=
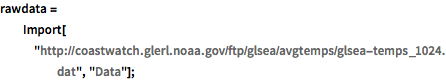
rawdata =
  Import["http://coastwatch.glerl.noaa.gov/ftp/glsea/avgtemps/glsea-\
temps_1024.dat", "Data"];
The observations begin from row 11.
In[2]:=
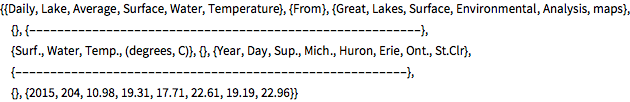
rawdata[[;; 11]]Out[2]=
In[3]:=
obs = rawdata[[11 ;;]];The number of observations.
In[4]:=
Length[obs]Out[4]=
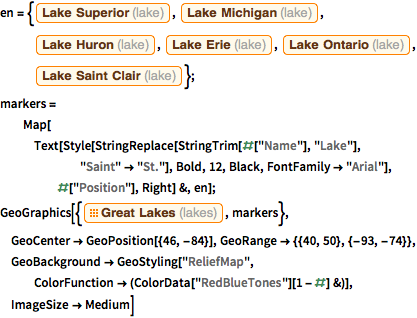
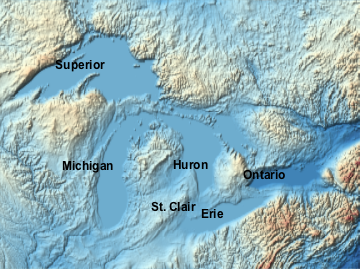
Define the list of lakes.
In[5]:=
lakes = {"Superior", "Michigan", "Huron", "Erie", "Ontario",
   "St. Clair"};
show complete Wolfram Language input
Out[6]=
Create dates to serve as time stamps in the TimeSeries.
In[7]:=
dates = Table[
   DatePlus[{obs[[k, 1]], 1, 1}, Quantity[obs[[k, 2]], "Days"]], {k,
    1, Length[obs]}];
Use QuantityArray to store the temperatures and the unit.
In[8]:=
values = QuantityArray[obs[[All, 3 ;;]], "DegreesCelsius"]Out[8]=
Store the list of the lakes as MetaInformation that can be retrieved later, for example, to create plot legends.
In[9]:=
ts = TimeSeries[values, {dates},
  MetaInformation -> {"Lakes" -> lakes}]
Out[9]=
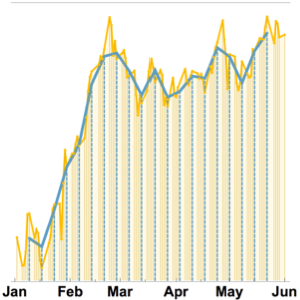
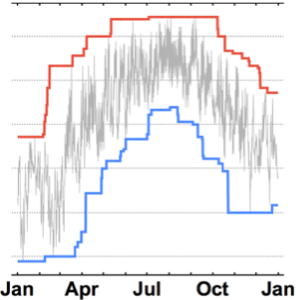
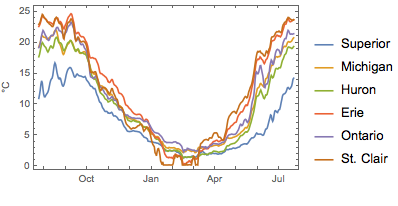
In[10]:=
DateListPlot[ts, PlotLegends -> ts["Lakes"], PlotTheme -> "Detailed",
 FrameLabel -> Automatic]
Out[10]=
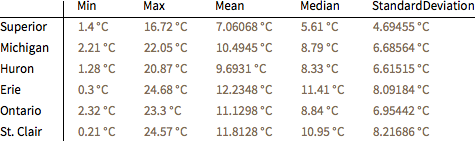
Study descriptive statistics for each lake.
In[11]:=
stats = {Min, Max, Mean, Median, StandardDeviation};
summary[lake_] := Map[#[lake] &, stats]
In[12]:=
TableForm[
 Table[summary[ts["PathComponent", k]], {k, 1, Length[lakes]}],
 TableHeadings -> {lakes, stats}]
Out[12]//TableForm=