趋势和季节性
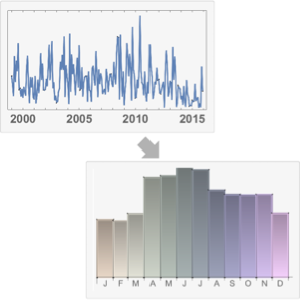
从 1949 年到 1960年的航空旅客人数一直在增加,但也随季节而变化. 在长度为年的不重叠窗口上同时应用 MovingMap 和 Total 来可视化年度增长. 对月数据应用 DateHistogram,并用年度日期归约来研究季节依赖性.
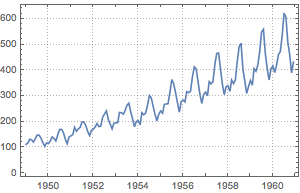
可以通过 ExampleData 得到 1949 年至 1960 年间每月国际航班乘客数.
In[1]:=
data = ExampleData[{"Statistics", "InternationalAirlinePassengers"},
  "TimeSeries"]
Out[1]=
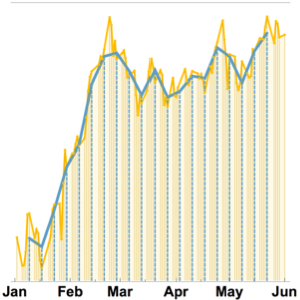
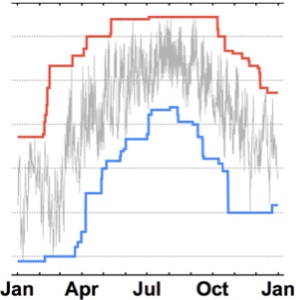
数据既显示了长时期内增加的趋势也显示了季节性的波动.
In[2]:=
DateListPlot[data, PlotTheme -> "Detailed"]Out[2]=
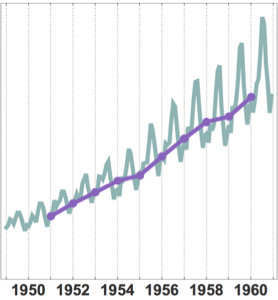
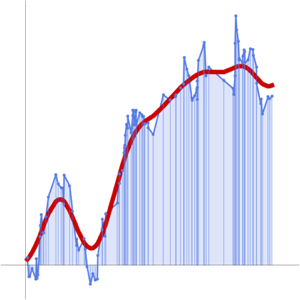
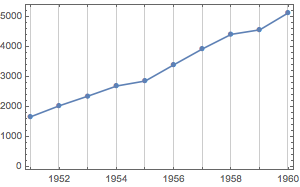
作年度汇总可看到全球趋势. 将汇总结果放在每年的最后一天,以使 1 年的移动窗口不重叠.
In[3]:=
positionspec = {{1949, 12, 31}, {1960, 12, 31}, Quantity[1, "Year"]};In[4]:=
mm = MovingMap[Total,
   data, {Quantity[1, "Years"], Right, positionspec}];
In[5]:=
DateListPlot[mm, PlotMarkers -> Automatic,
 GridLines -> {mm["Dates"], None}]
Out[5]=
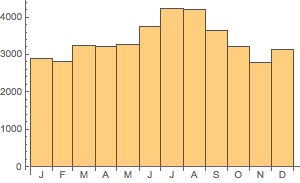
分析季节依赖性. 以乘客数作为日期的权重创建 WeightedData.
In[6]:=
wd = WeightedData[data["Dates"], data["Values"]];由于 DateReduction 的指定,DateHistogram 综合了各年份每个月的权重.
In[7]:=
DateHistogram[wd, "Month", DateReduction -> "Year"]Out[7]=