‹›Units & DatesVisualize Date Objects
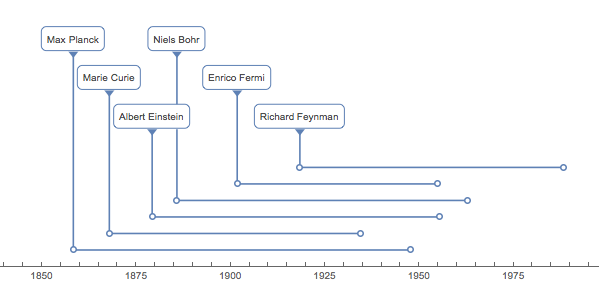
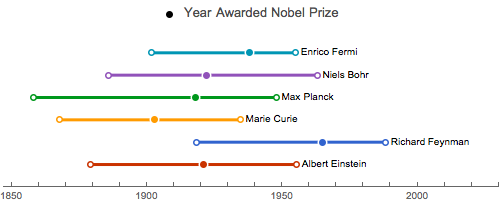
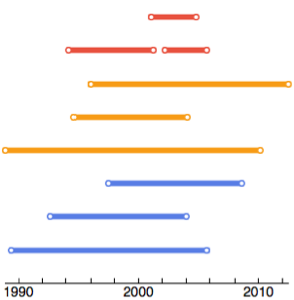
Use TimelinePlot to visualize time durations with labels. Show a list of Nobel Prize Laureates in physics.
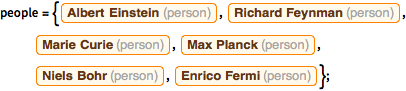
people = {Entity["Person", "AlbertEinstein::6tb7g"],
   Entity["Person", "RichardFeynman::qdvj4"],
   Entity["Person", "MarieCurie::v9f84"],
   Entity["Person", "MaxPlanck::73z39"],
   Entity["Person", "NielsBohr::8snv9"],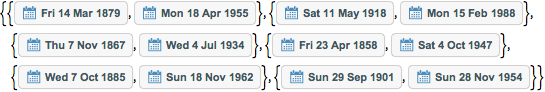
Entity["Person", "EnricoFermi::9k57b"]};lifespan = EntityValue[people, {"BirthDate", "DeathDate"}]TimelinePlot[Thread[Labeled[Interval /@ lifespan, people]]]Mix DateObject expressions and time intervals.
show complete Wolfram Language input
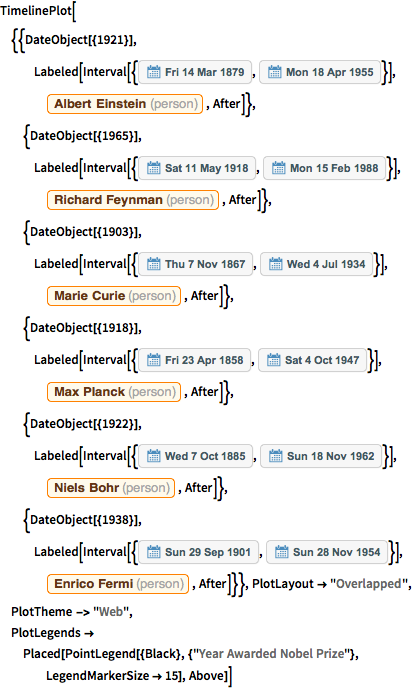
TimelinePlot[{{DateObject[{1921}],
   Labeled[Interval[{DateObject[{1879, 3, 14}],
      DateObject[{1955, 4, 18}]}],
    Entity["Person", "AlbertEinstein::6tb7g"],
    After]}, {DateObject[{1965}],
   Labeled[Interval[{DateObject[{1918, 5, 11}],
      DateObject[{1988, 2, 15}]}],
    Entity["Person", "RichardFeynman::qdvj4"],
    After]}, {DateObject[{1903}],
   Labeled[Interval[{DateObject[{1867, 11, 7}],
      DateObject[{1934, 7, 4}]}],
    Entity["Person", "MarieCurie::v9f84"],
    After]}, {DateObject[{1918}],
   Labeled[Interval[{DateObject[{1858, 4, 23}],
      DateObject[{1947, 10, 4}]}],
    Entity["Person", "MaxPlanck::73z39"],
    After]}, {DateObject[{1922}],
   Labeled[Interval[{DateObject[{1885, 10, 7}],
      DateObject[{1962, 11, 18}]}],
    Entity["Person", "NielsBohr::8snv9"],
    After]}, {DateObject[{1938}],
   Labeled[Interval[{DateObject[{1901, 9, 29}],
      DateObject[{1954, 11, 28}]}],
    Entity["Person", "EnricoFermi::9k57b"], After]}},
 PlotLayout -> "Overlapped", PlotTheme -> "Web",
 PlotLegends ->
  Placed[PointLegend[{Black}, {"Year Awarded Nobel Prize"},
    LegendMarkerSize -> 15], Above]]