‹›単位と日付地磁気データの可視化
可視化機能のあらゆるところで数量およびその配列を使う.
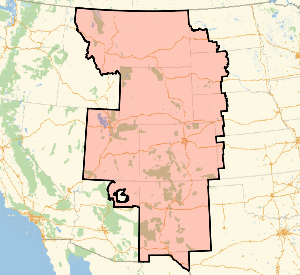
カザフスタン上の地球磁場の値の数量配列を得る.
data = GeomagneticModelData[Entity["Country", "Kazakhstan"],
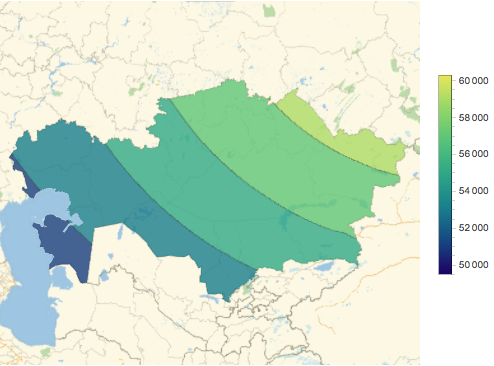
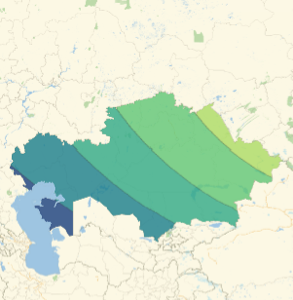
"Magnitude"]この地域における地球磁場の変化を調べる.
完全なWolfram言語入力を表示する
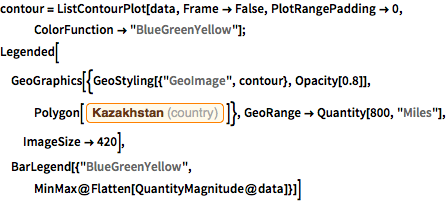
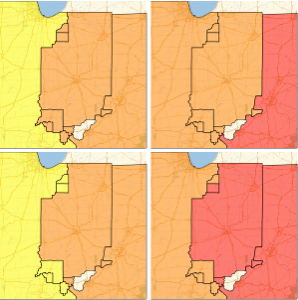
contour =
  ListContourPlot[data, Frame -> False, PlotRangePadding -> 0,
   ColorFunction -> "BlueGreenYellow"];
Legended[GeoGraphics[{GeoStyling[{"GeoImage", contour}, Opacity[0.8]],
    Polygon[Entity["Country", "Kazakhstan"]]},
  GeoRange -> Quantity[800, "Miles"], ImageSize -> 420],
 BarLegend[{"BlueGreenYellow",
   MinMax@Flatten[QuantityMagnitude@data]}]]