Etiquetado automático de datos
ListPlot y las funciones relacionadas ahora dan soporte a LabelingFunction.
muestre la entrada completa de Wolfram Language
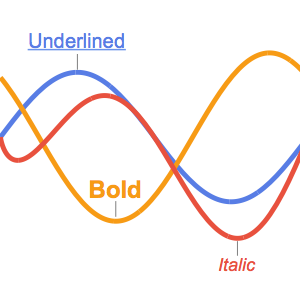
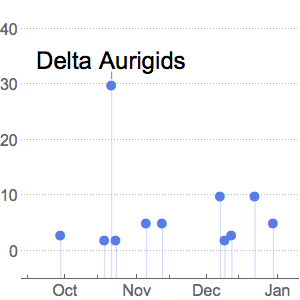
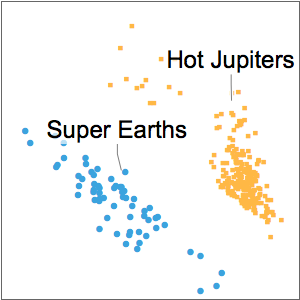
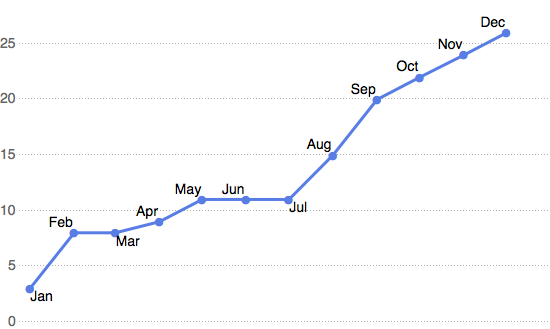
Cuando los metadatos apropiados están presentes, LabelingFunction los utiliza automáticamente como etiquetas.
In[2]:=
months = {"Jan", "Feb", "Mar", "Apr", "May", "Jun", "Jul", "Aug",
   "Sep", "Oct", "Nov", "Dec"};
In[3]:=
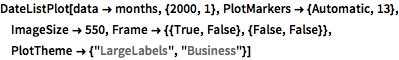
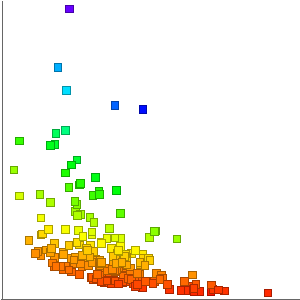
DateListPlot[data -> months, {2000, 1},
 PlotMarkers -> {Automatic, 13}, ImageSize -> 550,
 Frame -> {{True, False}, {False, False}},
 PlotTheme -> {"LargeLabels", "Business"}]
Out[3]=
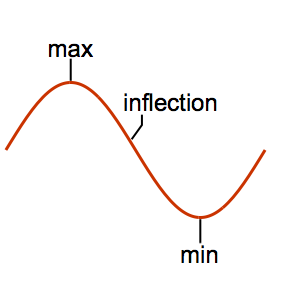
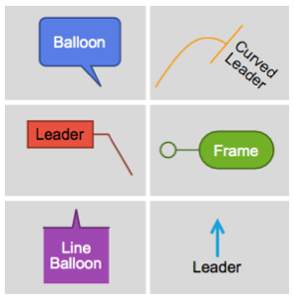
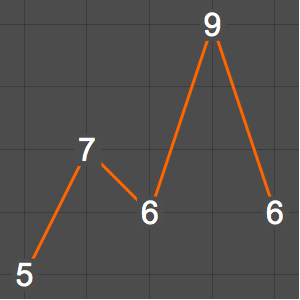
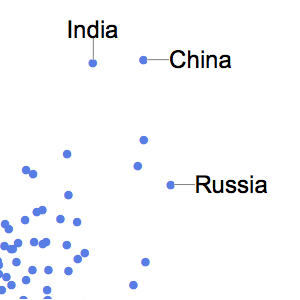
Use Callout en LabelingFunction.
In[4]:=
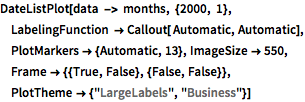
DateListPlot[data -> months, {2000, 1},
 LabelingFunction -> Callout[ Automatic, Automatic],
 PlotMarkers -> {Automatic, 13}, ImageSize -> 550,
 Frame -> {{True, False}, {False, False}},
 PlotTheme -> {"LargeLabels", "Business"}]
Out[4]=
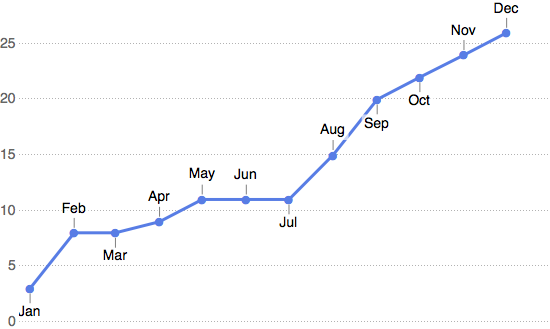
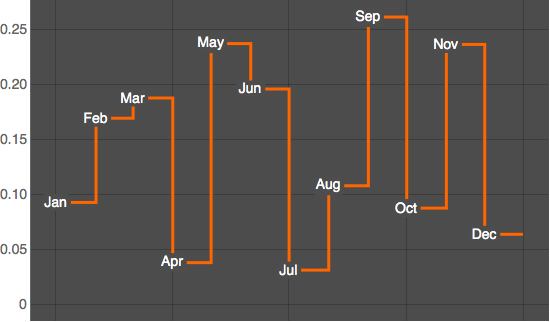
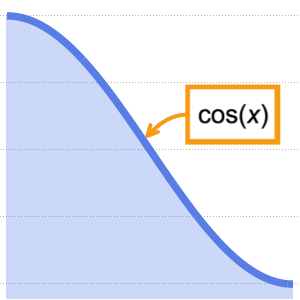
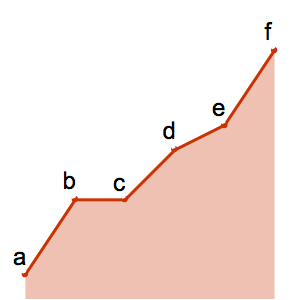
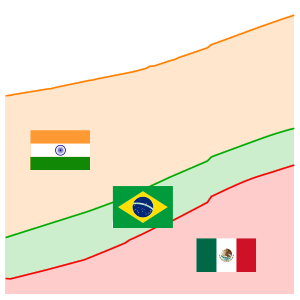
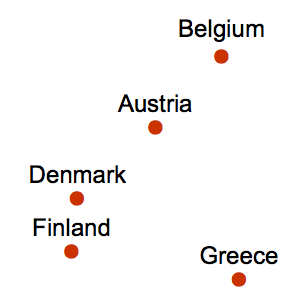
Coloque las etiquetas centradas donde están los datos.
In[5]:=
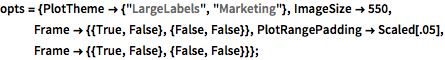
opts = {PlotTheme -> {"LargeLabels", "Marketing"}, ImageSize -> 550,
   Frame -> {{True, False}, {False, False}},
   PlotRangePadding -> Scaled[.05],
   Frame -> {{True, False}, {False, False}}};
In[6]:=
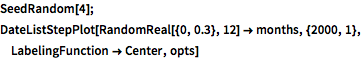
SeedRandom[4]; DateListStepPlot[
 RandomReal[{0, 0.3}, 12] -> months, {2000, 1},
 LabelingFunction -> Center, opts]
Out[6]=