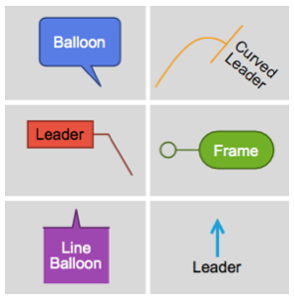
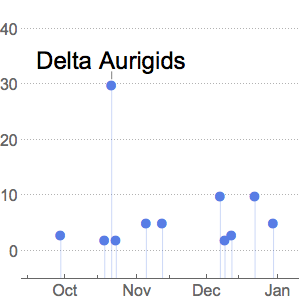
データの自動ラベル付け
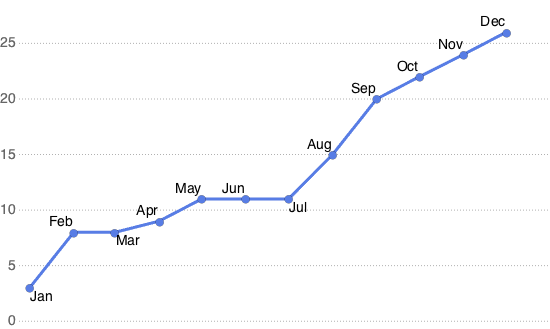
ListPlotおよび関連関数は,LabelingFunctionをサポートするようになった.
完全なWolfram言語入力を表示する
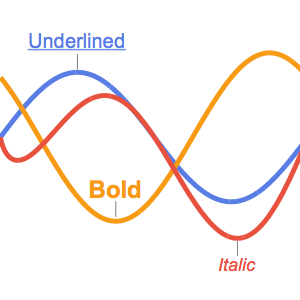
適切なメタデータがある場合,LabelingFunctionはラベルとして自動的にこれを使う.
In[2]:=
months = {"Jan", "Feb", "Mar", "Apr", "May", "Jun", "Jul", "Aug",
   "Sep", "Oct", "Nov", "Dec"};
In[3]:=
DateListPlot[data -> months, {2000, 1},
 PlotMarkers -> {Automatic, 13}, ImageSize -> 550,
 Frame -> {{True, False}, {False, False}},
 PlotTheme -> {"LargeLabels", "Business"}]
Out[3]=
In[4]:=
DateListPlot[data -> months, {2000, 1},
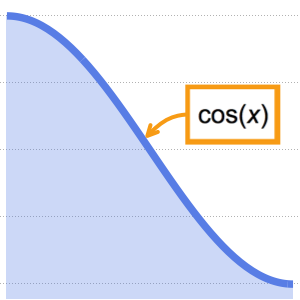
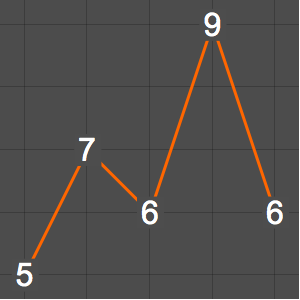
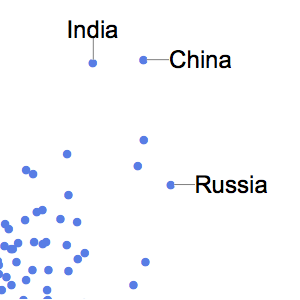
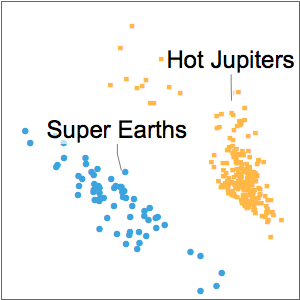
LabelingFunction -> Callout[ Automatic, Automatic],
PlotMarkers -> {Automatic, 13}, ImageSize -> 550,
Frame -> {{True, False}, {False, False}},
PlotTheme -> {"LargeLabels", "Business"}]Out[4]=
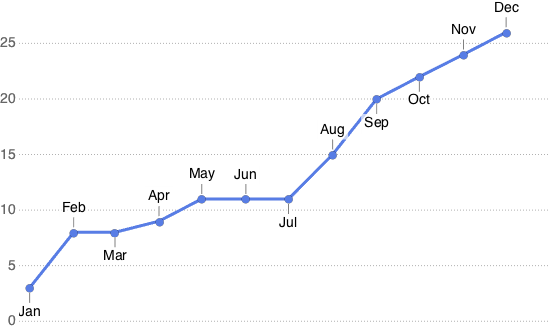
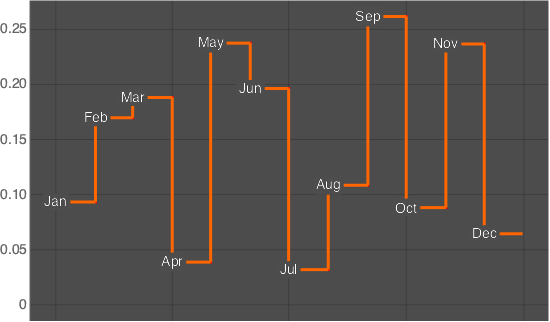
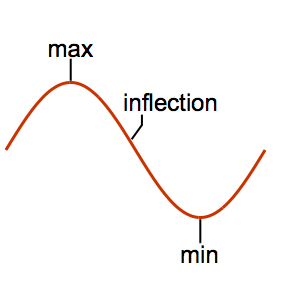
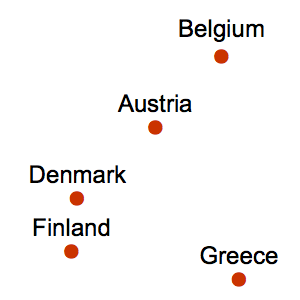
データ点の上に,その点を中心にしてラベルを置く.
In[5]:=
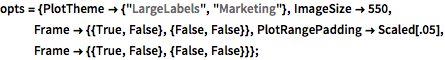
opts = {PlotTheme -> {"LargeLabels", "Marketing"}, ImageSize -> 550,
   Frame -> {{True, False}, {False, False}},
   PlotRangePadding -> Scaled[.05],
   Frame -> {{True, False}, {False, False}}};
In[6]:=
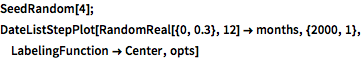
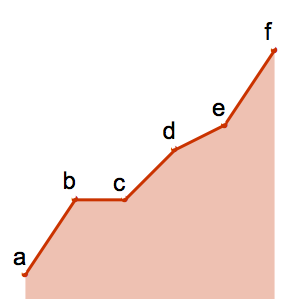
SeedRandom[4]; DateListStepPlot[
 RandomReal[{0, 0.3}, 12] -> months, {2000, 1},
 LabelingFunction -> Center, opts]
Out[6]=