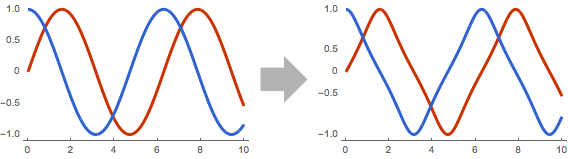
Define a Scaling Function
Use any function and its inverse to scale data.
show complete Wolfram Language input
In[2]:=
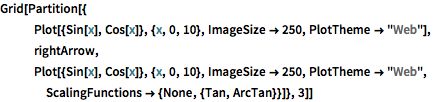
Grid[Partition[{
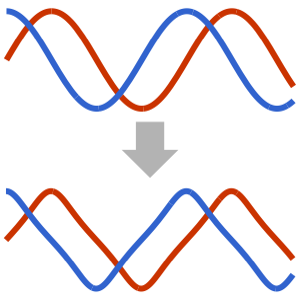
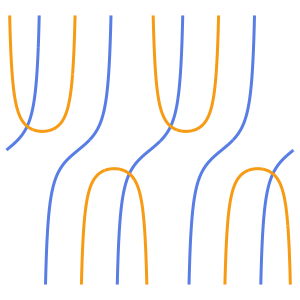
Plot[{Sin[x], Cos[x]}, {x, 0, 10}, ImageSize -> 250,
PlotTheme -> "Web"],
rightArrow,
Plot[{Sin[x], Cos[x]}, {x, 0, 10}, ImageSize -> 250,
PlotTheme -> "Web", ScalingFunctions -> {None, {Tan, ArcTan}}]},
3]]Out[2]=