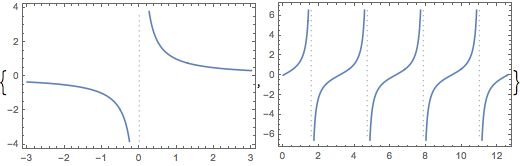
Détectez et supprimez des points singuliers
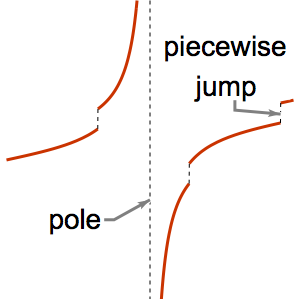
Le pôle de Il en est de même pour les pôles de Tan[x]. Affichez les asymptotes correspondants aux pôles. en
en  In[1]:=
![]()
Plot[1/x, {x, -3, 3}, ImageSize -> 400, PlotTheme -> "Frame"]Out[1]=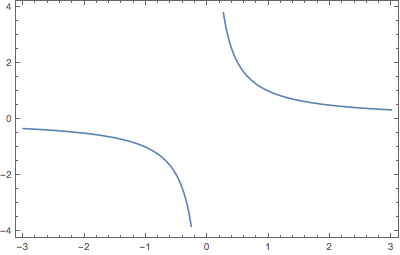 In[2]:=
![]()
Plot[Tan[x], {x, 0, 4 Pi}, ImageSize -> 400, PlotTheme -> "Frame"]Out[2]=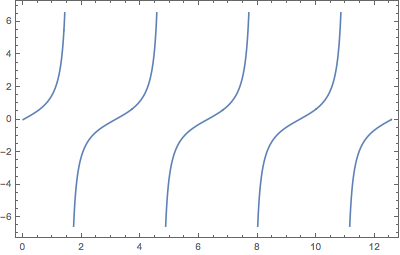 In[3]:=
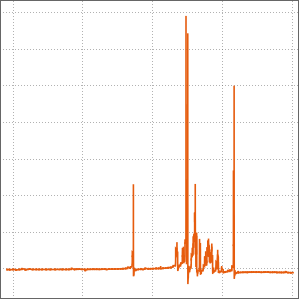
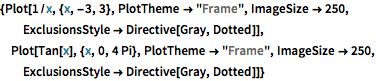
{Plot[1/x, {x, -3, 3}, PlotTheme -> "Frame", ImageSize -> 250,
  ExclusionsStyle -> Directive[Gray, Dotted]],
 Plot[Tan[x], {x, 0, 4 Pi}, PlotTheme -> "Frame", ImageSize -> 250,
  ExclusionsStyle -> Directive[Gray, Dotted]]}
Out[3]=