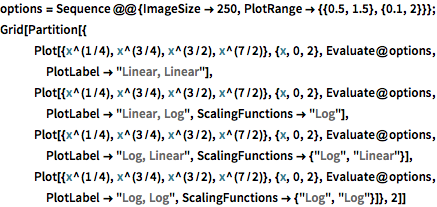
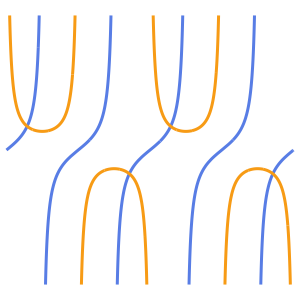
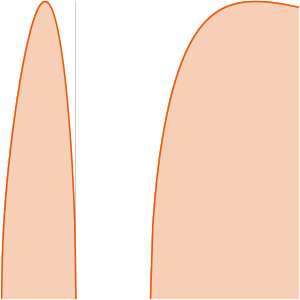
‹›Visualisation : étiquettes, échelles, exclusionsÉchantillonnez n'importe quel axe
Appliquez des fonctions d'échelonnement à un axe.
Afficher l'entrée complète de Wolfram Language
options =
Sequence @@ {ImageSize -> 250,
PlotRange -> {{0.5, 1.5}, {0.1, 2}}};
Grid[Partition[{
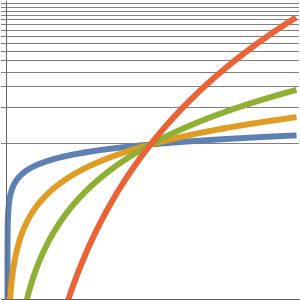
Plot[{x^(1/4), x^(3/4), x^(3/2), x^(7/2)}, {x, 0, 2},
Evaluate@options, PlotLabel -> "Linear, Linear"],
Plot[{x^(1/4), x^(3/4), x^(3/2), x^(7/2)}, {x, 0, 2},
Evaluate@options, PlotLabel -> "Linear, Log",
ScalingFunctions -> "Log"],
Plot[{x^(1/4), x^(3/4), x^(3/2), x^(7/2)}, {x, 0, 2},
Evaluate@options, PlotLabel -> "Log, Linear",
ScalingFunctions -> {"Log", "Linear"}],
Plot[{x^(1/4), x^(3/4), x^(3/2), x^(7/2)}, {x, 0, 2},
Evaluate@options, PlotLabel -> "Log, Log",
ScalingFunctions -> {"Log", "Log"}]}, 2]]