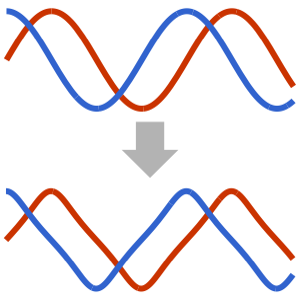
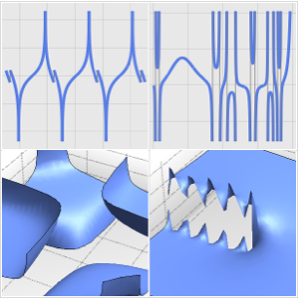
New Labeling System
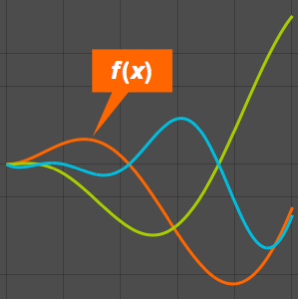
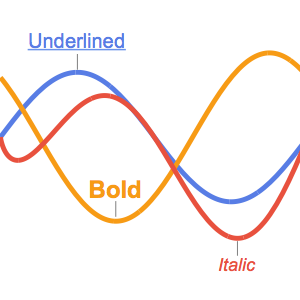
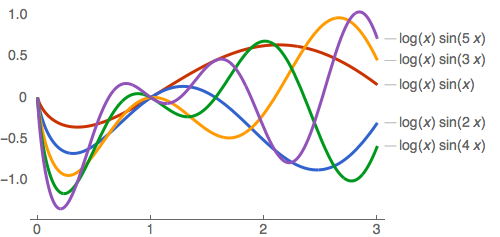
Use the PlotLabels option to add expressions as labels automatically.
In[1]:=
Plot[Evaluate[Table[Log[x] Sin[i x], {i, 1, 5}]], {x, 0, 3},
 PlotLabels -> Automatic, ImageSize -> 500,
 PlotTheme -> {"Web", "LargeLabels"}]
Out[1]=
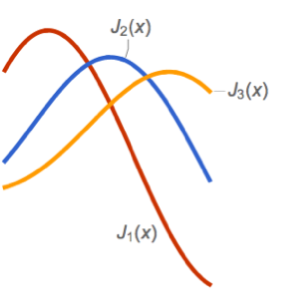
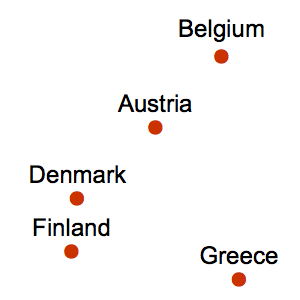
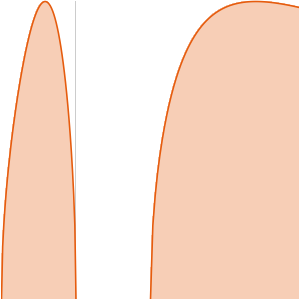
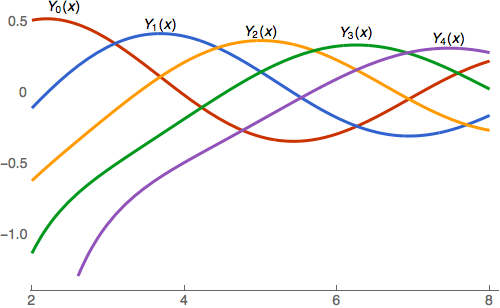
Use the Labeled wrapper to place the labels close to the curves.
In[2]:=
Plot[Evaluate[
  Table[Labeled[BesselY[i, x], BesselY[i, x], Above], {i, 0, 4}]], {x,
   2, 8}, ImageSize -> 500, PlotTheme -> {"Web", "LargeLabels"}]
Out[2]=
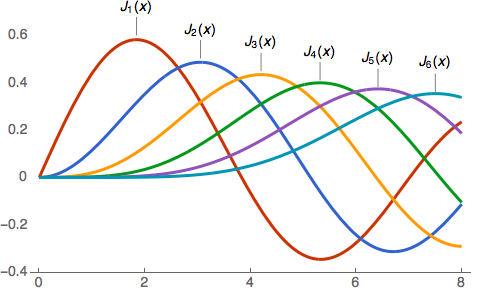
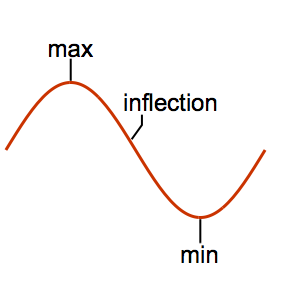
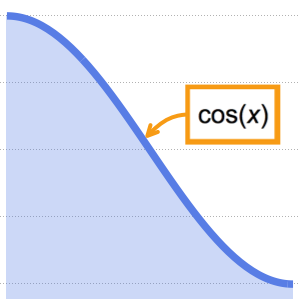
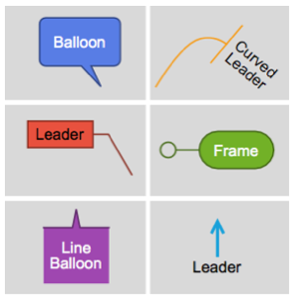
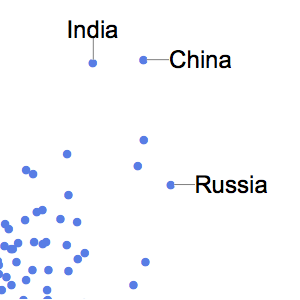
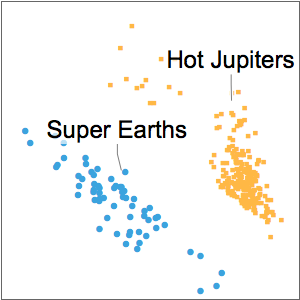
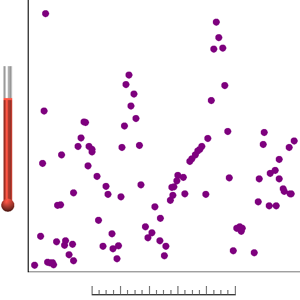
Use the Callout wrapper to point the labels to the curves.
In[3]:=
Plot[Evaluate@
  Table[Callout[BesselJ[i, x], BesselJ[i, x], Above], {i, 1, 6}], {x,
  0, 8}, ImageSize -> 500, PlotTheme -> {"Web", "LargeLabels"}]
Out[3]=