‹›立体可视化可视化切片
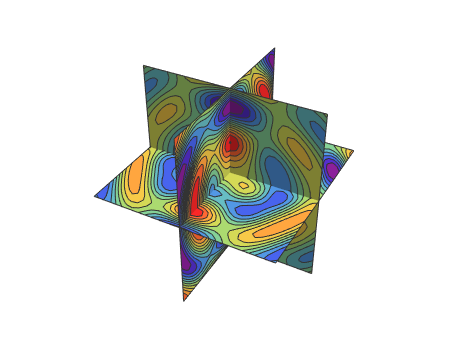
用多个相交平面作为表面,在其上绘制函数的等值线图.
显示完整的 Wolfram 语言输入
opts = {ColorFunction -> ColorData[{"Rainbow", {-2.5, 2.5}}],
   ColorFunctionScaling -> False, ClippingStyle -> Automatic,
   PlotTheme -> "Bare", SphericalRegion -> True, ImageSize -> 250,
Contours -> Subdivide[-2.5, 2.5, 10]};func = Simplify[
Sum[Cos[5 Norm[{x, y, z} - {Sin[\[Theta]], Cos[\[Theta]],
0}]], {\[Theta], 0, 2 \[Pi] - (2 \[Pi])/3, (2 \[Pi])/
3}], (x | y | z) \[Element] Reals];With[{k = 1},
SliceContourPlot3D[
func, {x == -k, x == k, y == -k, y == k, z == -k, z == k}, {x, -2,
2}, {y, -2, 2}, {z, -2, 2}, Evaluate@opts]
]用一个p-范数球作为表面.
With[{p = 5},
 SliceContourPlot3D[func,
  BoundaryDiscretizeRegion[
   ImplicitRegion[
    Norm[{x, y, z}, p] <=
     2, {{x, -2, 2}, {y, -2, 2}, {z, -2, 2}}], {{-2, 2}, {-2, 2}, {-2,
      2}}, MaxCellMeasure -> {"Length" -> 0.05}], {x, -2, 2}, {y, -2,
   2}, {z, -2, 2}, Evaluate@opts]
]用一个球体以及与之相交的圆盘作为表面.
显示完整的 Wolfram 语言输入
sphere = BoundaryDiscretizeRegion[
   ImplicitRegion[Norm[{x, y, z}, 2] <= 1,
    {{x, -2, 2}, {y, -2, 2}, {z, -2, 2}}], {{-2, 2}, {-2, 2}, {-2,
2}}, MaxCellMeasure -> {"Length" -> 0.05}];planes = With[{r = 2}, DiscretizeRegion[ImplicitRegion[
(x^2 + y^2 <= r^2 && z == 0) || (x^2 + z^2 <= r^2 &&
y == 0) || (z^2 + y^2 <= r^2 && x == 0),
{{x, -2, 2}, {y, -2, 2}, {z, -2, 2}}], {{-2, 2}, {-2, 2}, {-2,
2}}, MaxCellMeasure -> {"Length" -> 0.05}]
];SliceContourPlot3D[func, {sphere, planes}, {x, -2, 2}, {y, -2,
2}, {z, -2, 2}, Evaluate@opts]从表面的不同参数设置之间的平滑过渡得到一个有趣的影片.


