Visualize Slices
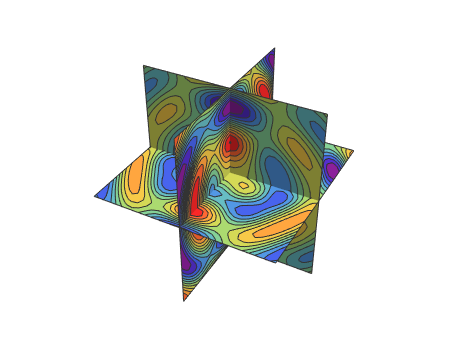
Use multiple intersecting planes as the surfaces on which to plot the contours of a function.
show complete Wolfram Language input
In[3]:=

With[{k = 1},
 SliceContourPlot3D[
  func, {x == -k, x == k, y == -k, y == k, z == -k, z == k}, {x, -2,
   2}, {y, -2, 2}, {z, -2, 2}, Evaluate@opts]
 ]
Out[3]=

Use a  -norm ball as the surface.
In[4]:=

With[{p = 5},
 SliceContourPlot3D[func,
  BoundaryDiscretizeRegion[
   ImplicitRegion[
    Norm[{x, y, z}, p] <=
     2, {{x, -2, 2}, {y, -2, 2}, {z, -2, 2}}], {{-2, 2}, {-2, 2}, {-2,
      2}}, MaxCellMeasure -> {"Length" -> 0.05}], {x, -2, 2}, {y, -2,
   2}, {z, -2, 2}, Evaluate@opts]
 ]
Out[4]=

Use a sphere and intersecting disks as the surfaces.
show complete Wolfram Language input
In[7]:=
SliceContourPlot3D[func, {sphere, planes}, {x, -2, 2}, {y, -2,
  2}, {z, -2, 2}, Evaluate@opts]
Out[7]=

Smoothly transition between different parameter settings for the surfaces to get an interesting movie.


